Analytics Report - Tiles
Tiles Option
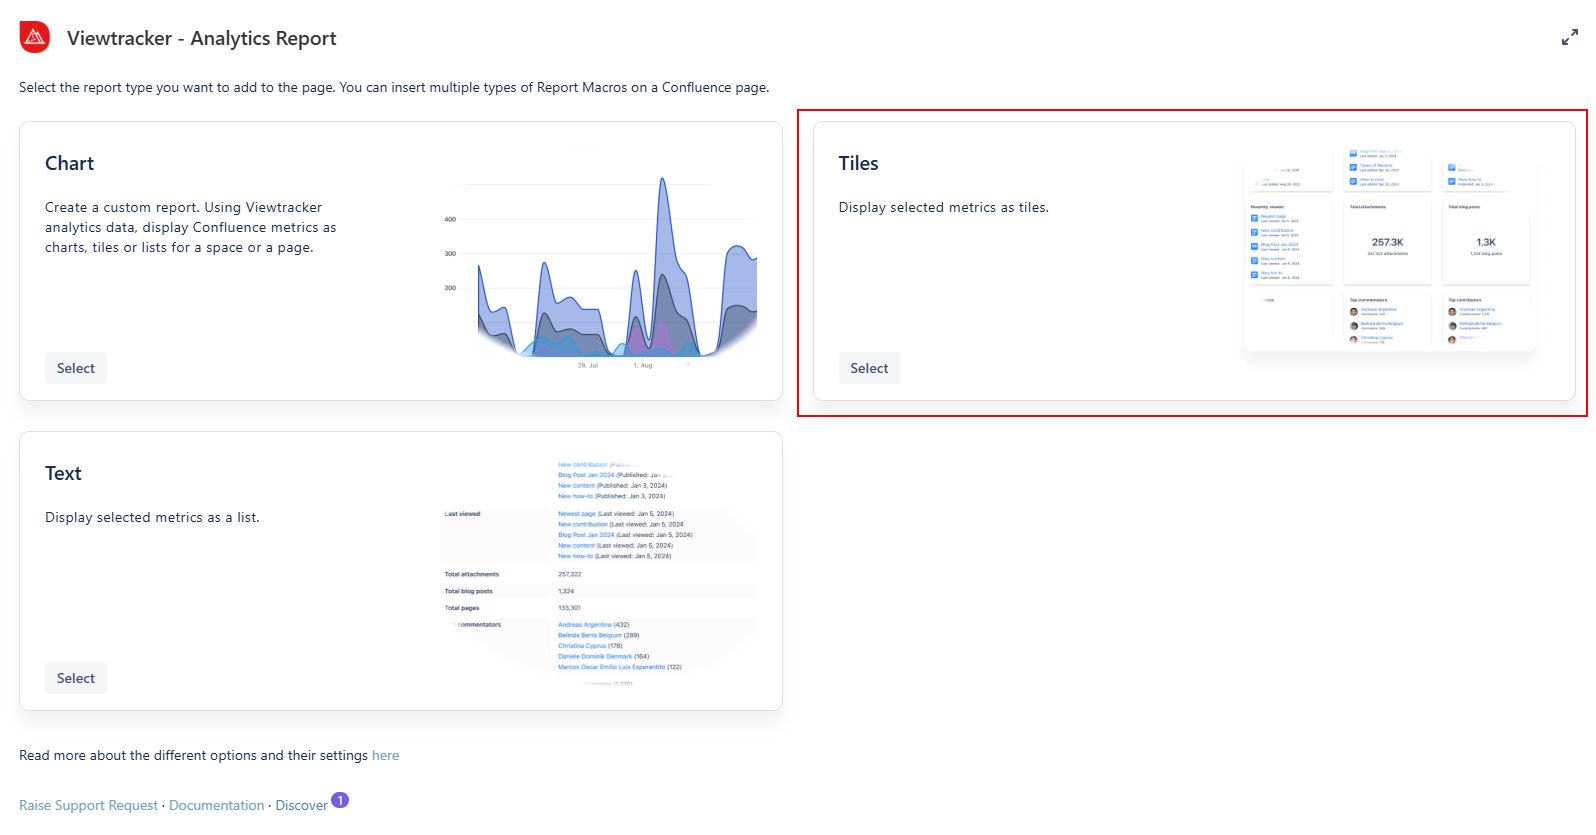
Screenshot highlighting the Tiles option
How to use the tiles option?
Insert the Analytics Report macro on a page.
Click “Tiles” within the Analytics Report.
In the field “Content,” you can select between a space or a page.
You can type in the specific name of the space or page.
Adapt the general settings (see options below).
Use the preview to check if everything looks as expected.
Tap “Save” and publish the page.
Result: The metrics of the selected page or space are displayed as a macro.
The general settings of this option
Content - You can filter for a space, a page, or a blog post.
CQL Filter - Use Confluence Query Language (CQL) to customize your report by applying specific filters.
Metrics - These are the same as those in the Viewtracker Reports (see the expansion below).
Please note: Metrics differ if a space or a page is defined.
Attachment Storage
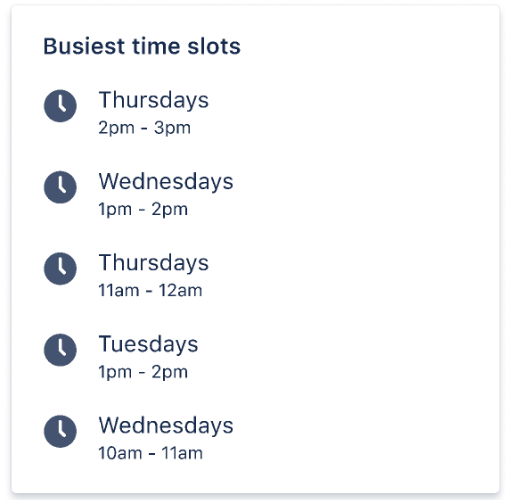
Busiest time slots
Largest attachments
Last modified
Last viewed
Most commented content
Most edited content
Most liked content
Most viewed attachments
Most viewed pages and blog posts
Newly published
Number of active users
Number of attachment viewers
Number of attachment views
Number of content created
Number of content deletions
Number of contributors
Number of edits
Number of engaged users
Number of likes (on comment)
Number of likes (on content)
Number of new attachments
Number of new blog posts
Number of new comments
Number of new pages
Number of viewed attachments
Number of viewed blog posts
Number of viewed pages
Number of viewers
Number of views
Number of watches
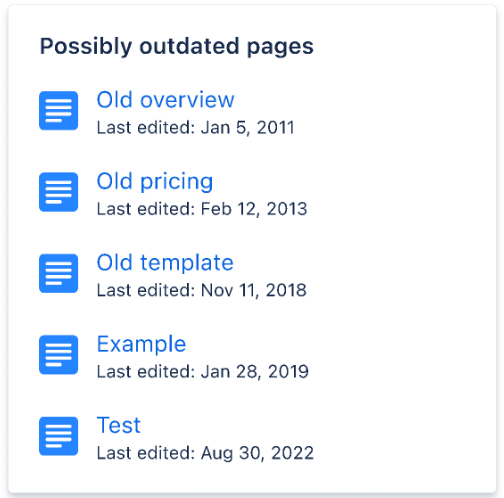
Possibly outdated pages
Total attachments (end of date range)
Total blog posts (end of date range)
Total pages (end of date range)
Top commentators
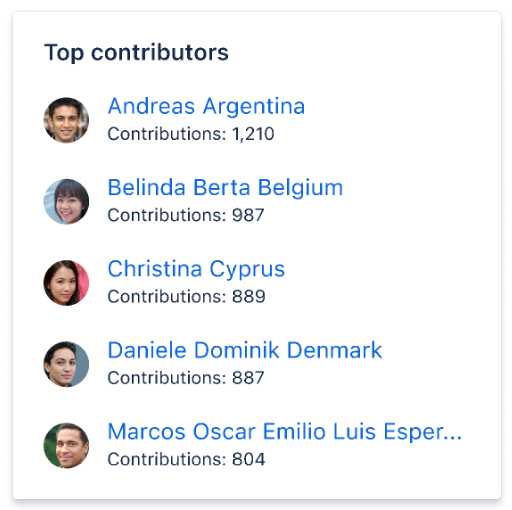
Top Contributors
Top engaged users
Top Viewers
Date Range - Two types of date ranges can be set:
Relative: The default setting. It will continually update itself to the previous day.
Fixed: You can manually specify the start and end date of the report.
Display - Change the order of the tiles by dragging and dropping the existing Metrics.
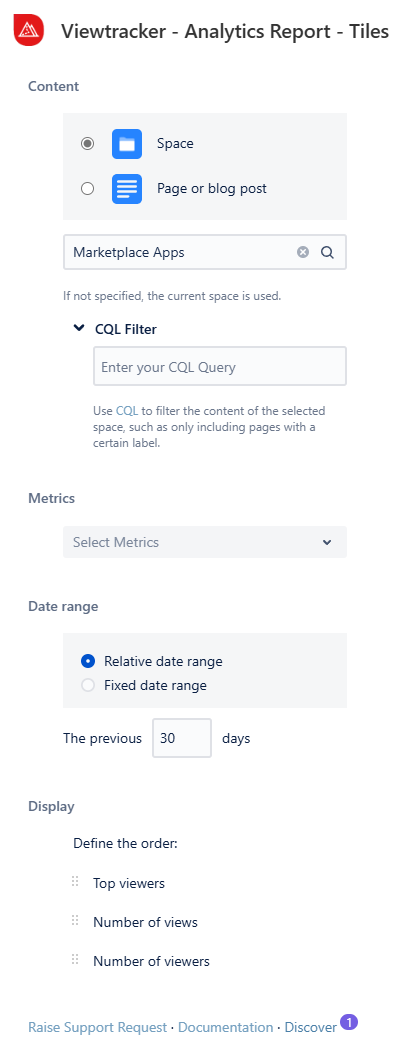
Settings available in the Tiles option
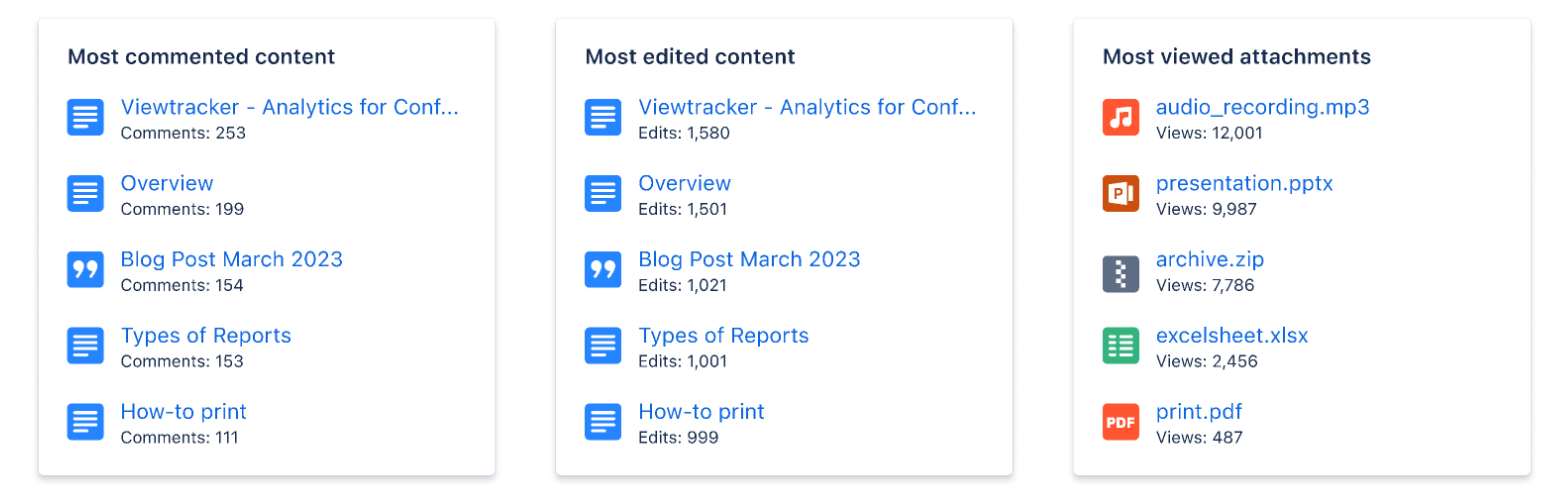
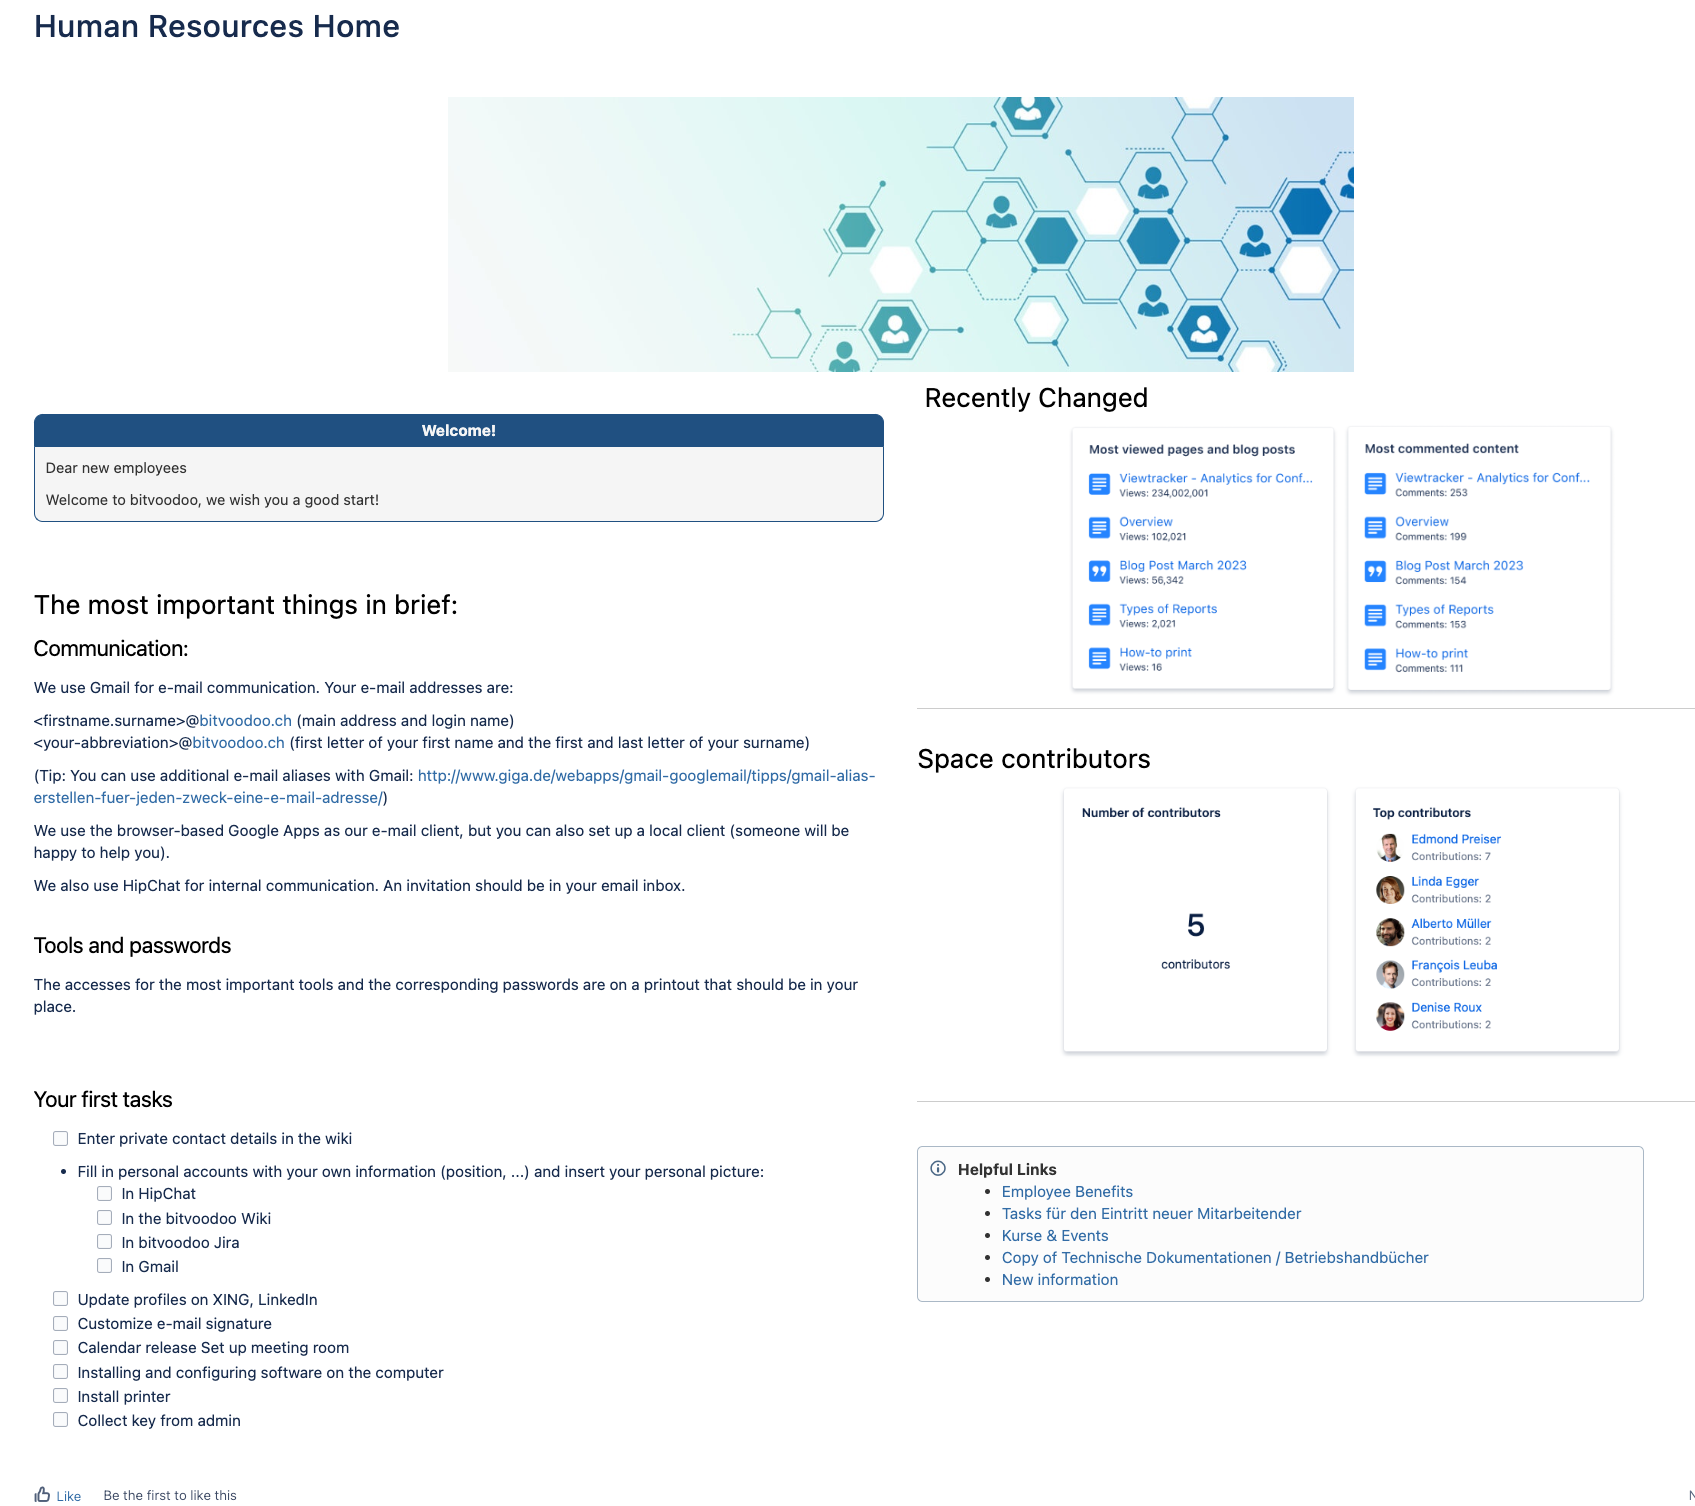
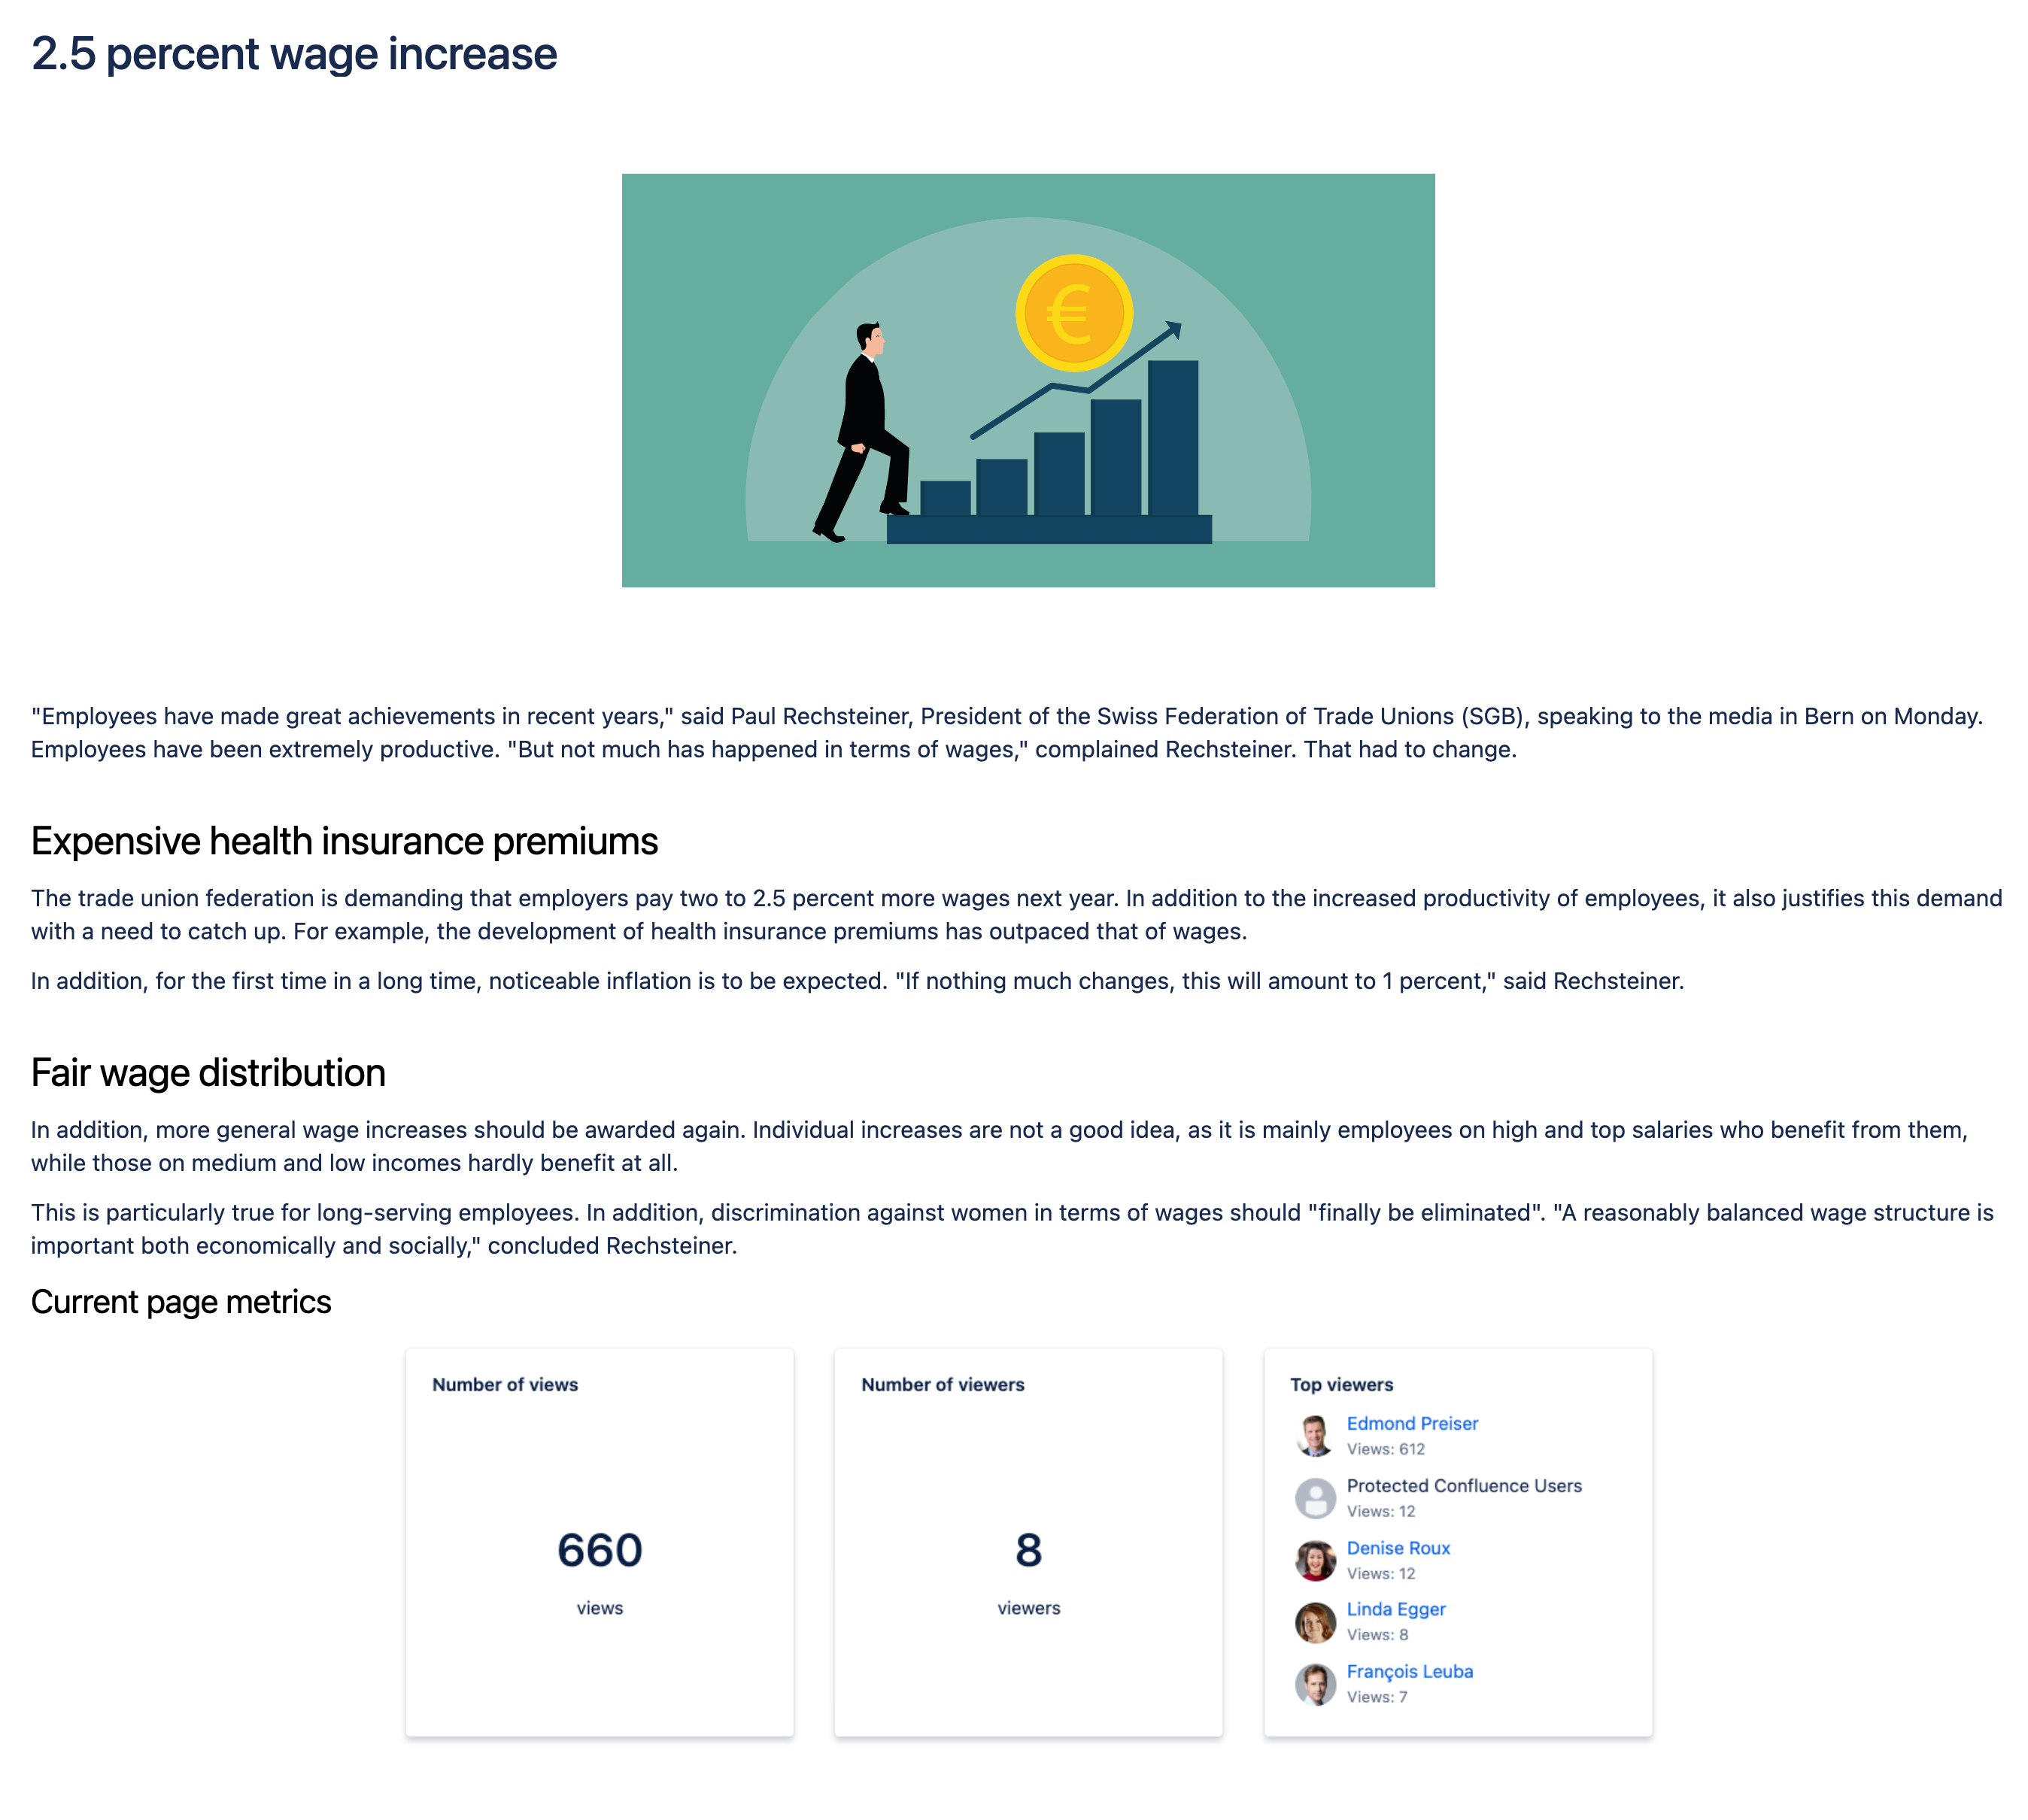
Examples of tiles
Examples Use Cases
Example use case 1: Personalized Landing Hub
Would you like to personalize a landing hub for each team and display all the latest news and discussions around their content?
With the tiles option, you can create eye-catching tiles to display specific information about the current space.
Use case 2: Displaying the metrics surrounding important news
Do you need to release important news? Enrich them with relevant lists or key figures.
List relevant content or user lists in tiles on specific topics and news.
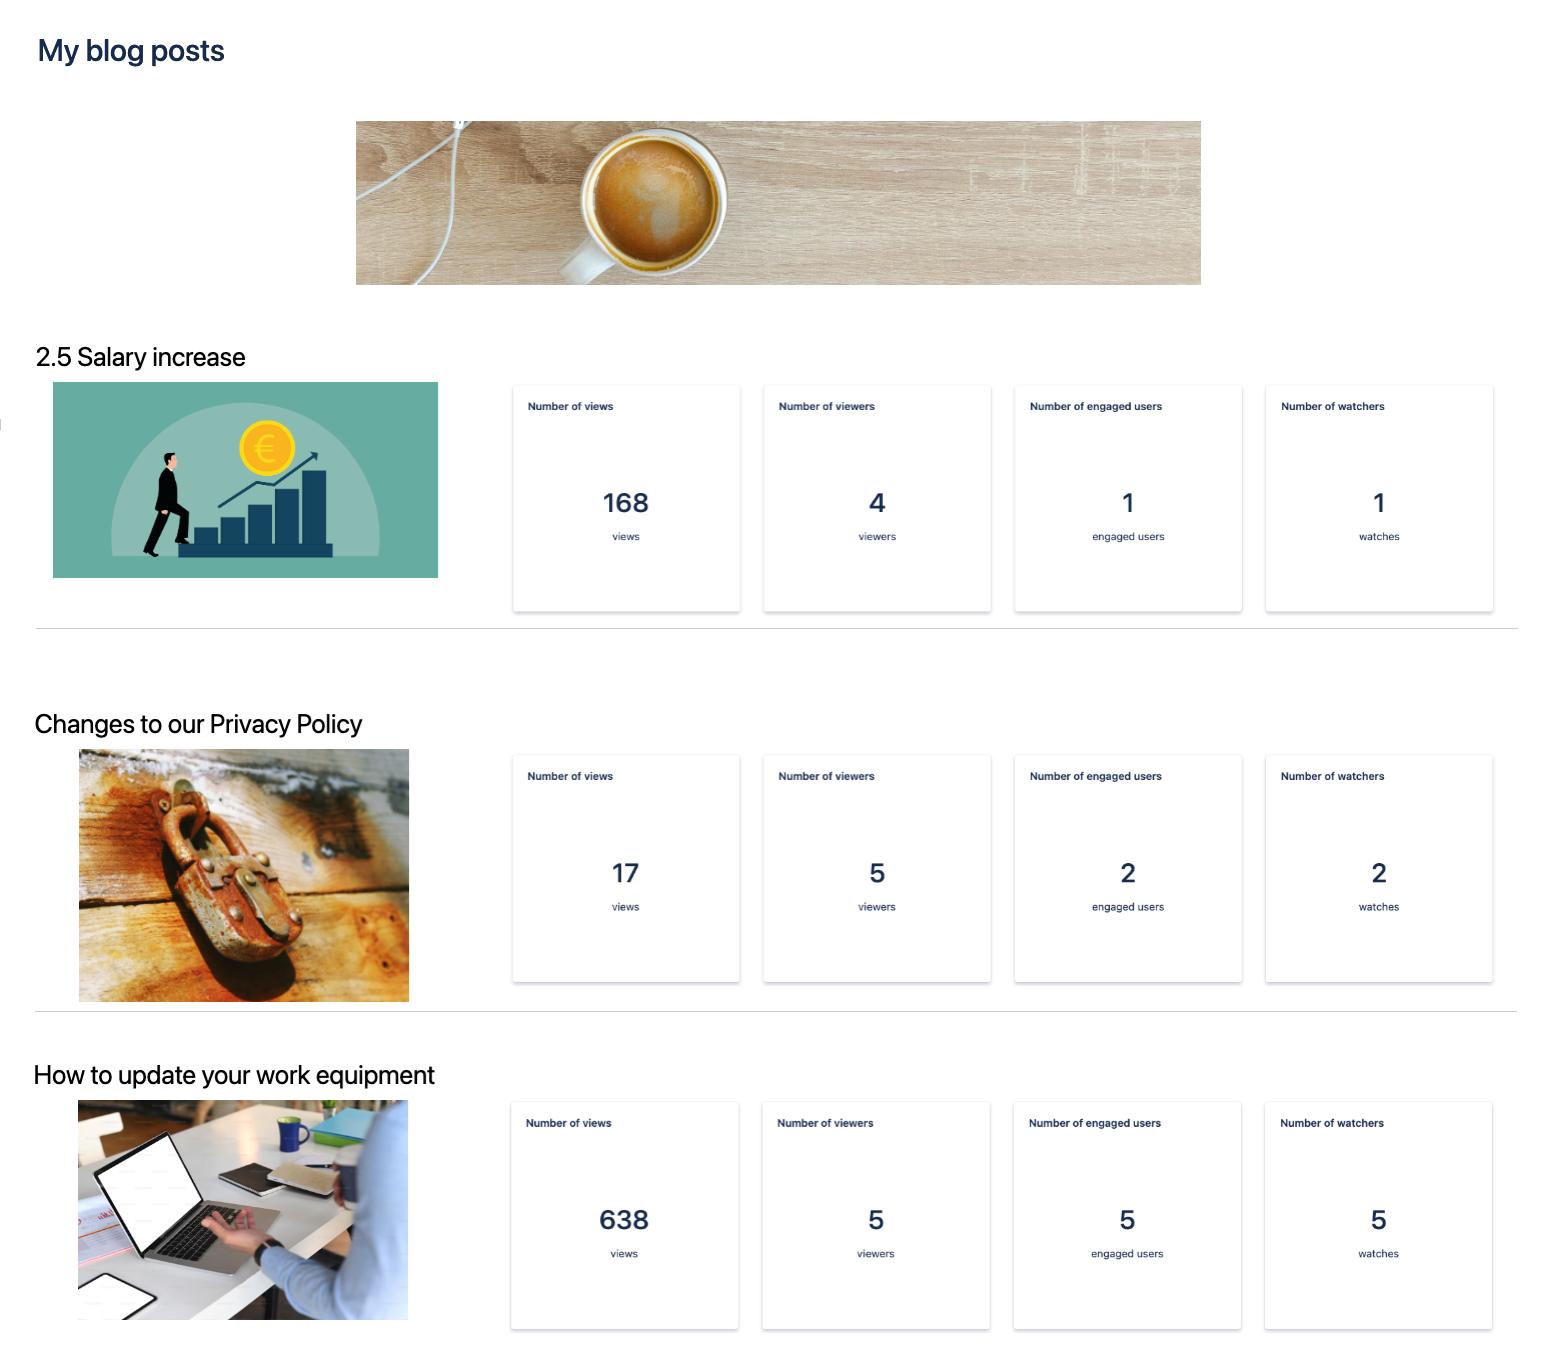
Use case 3: Compare the performance of different blog posts or news
Do you want to compare the performance of the most important blog posts for the same duration from the publication date?
Place a macro for each blog post and its desired key figures and set the respective time window since its publication.