Analytics Report - Text
Text option
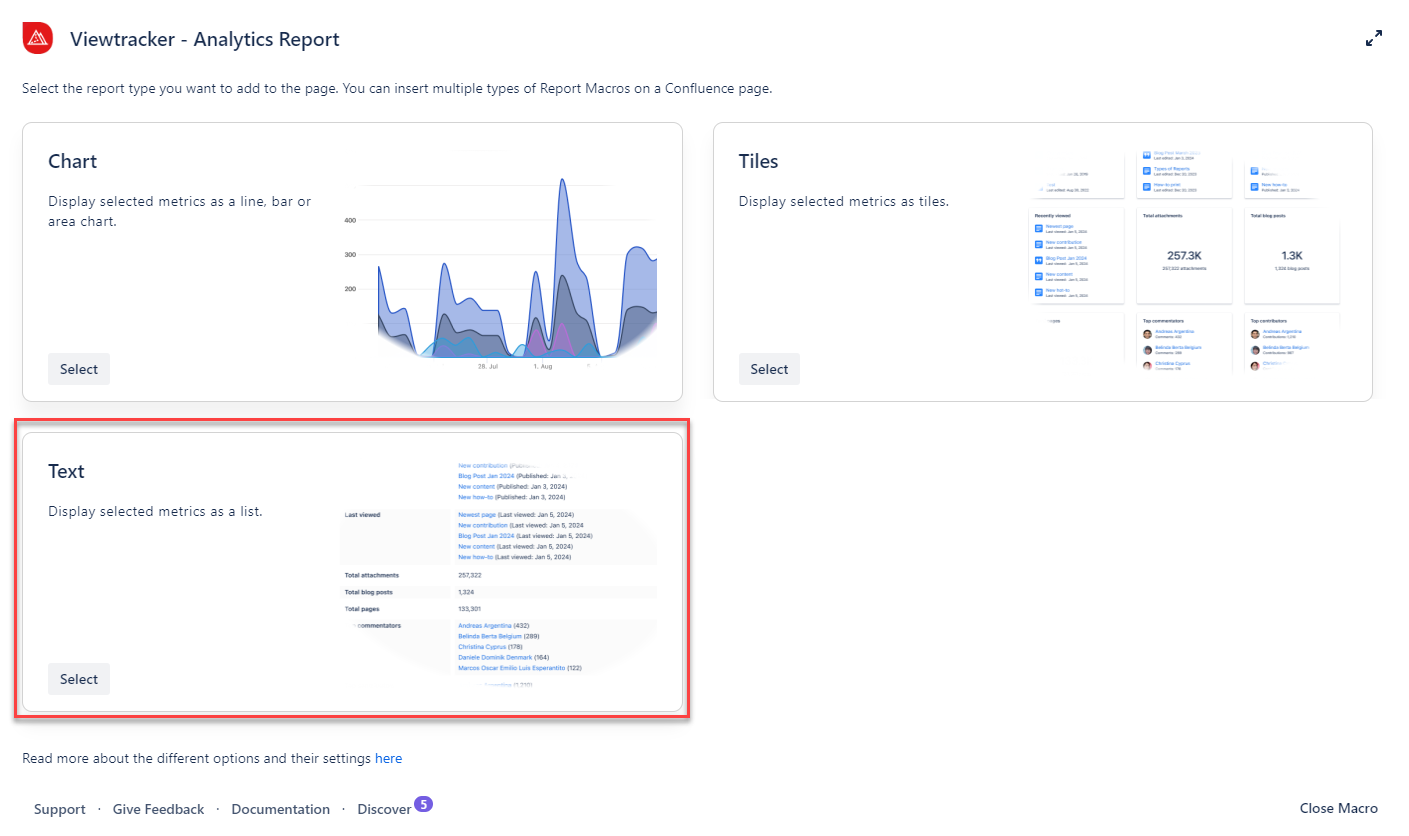
How to use the Text option? 📔
Insert the Analytics Report macro on a page.
Click “Text” within the Analytics Report.
In the field “Content,” you can select between a Page or a Space.
Adapt the general settings (see options below).
Use the preview to check if everything looks as expected.
Tap “Save” and publish the page.
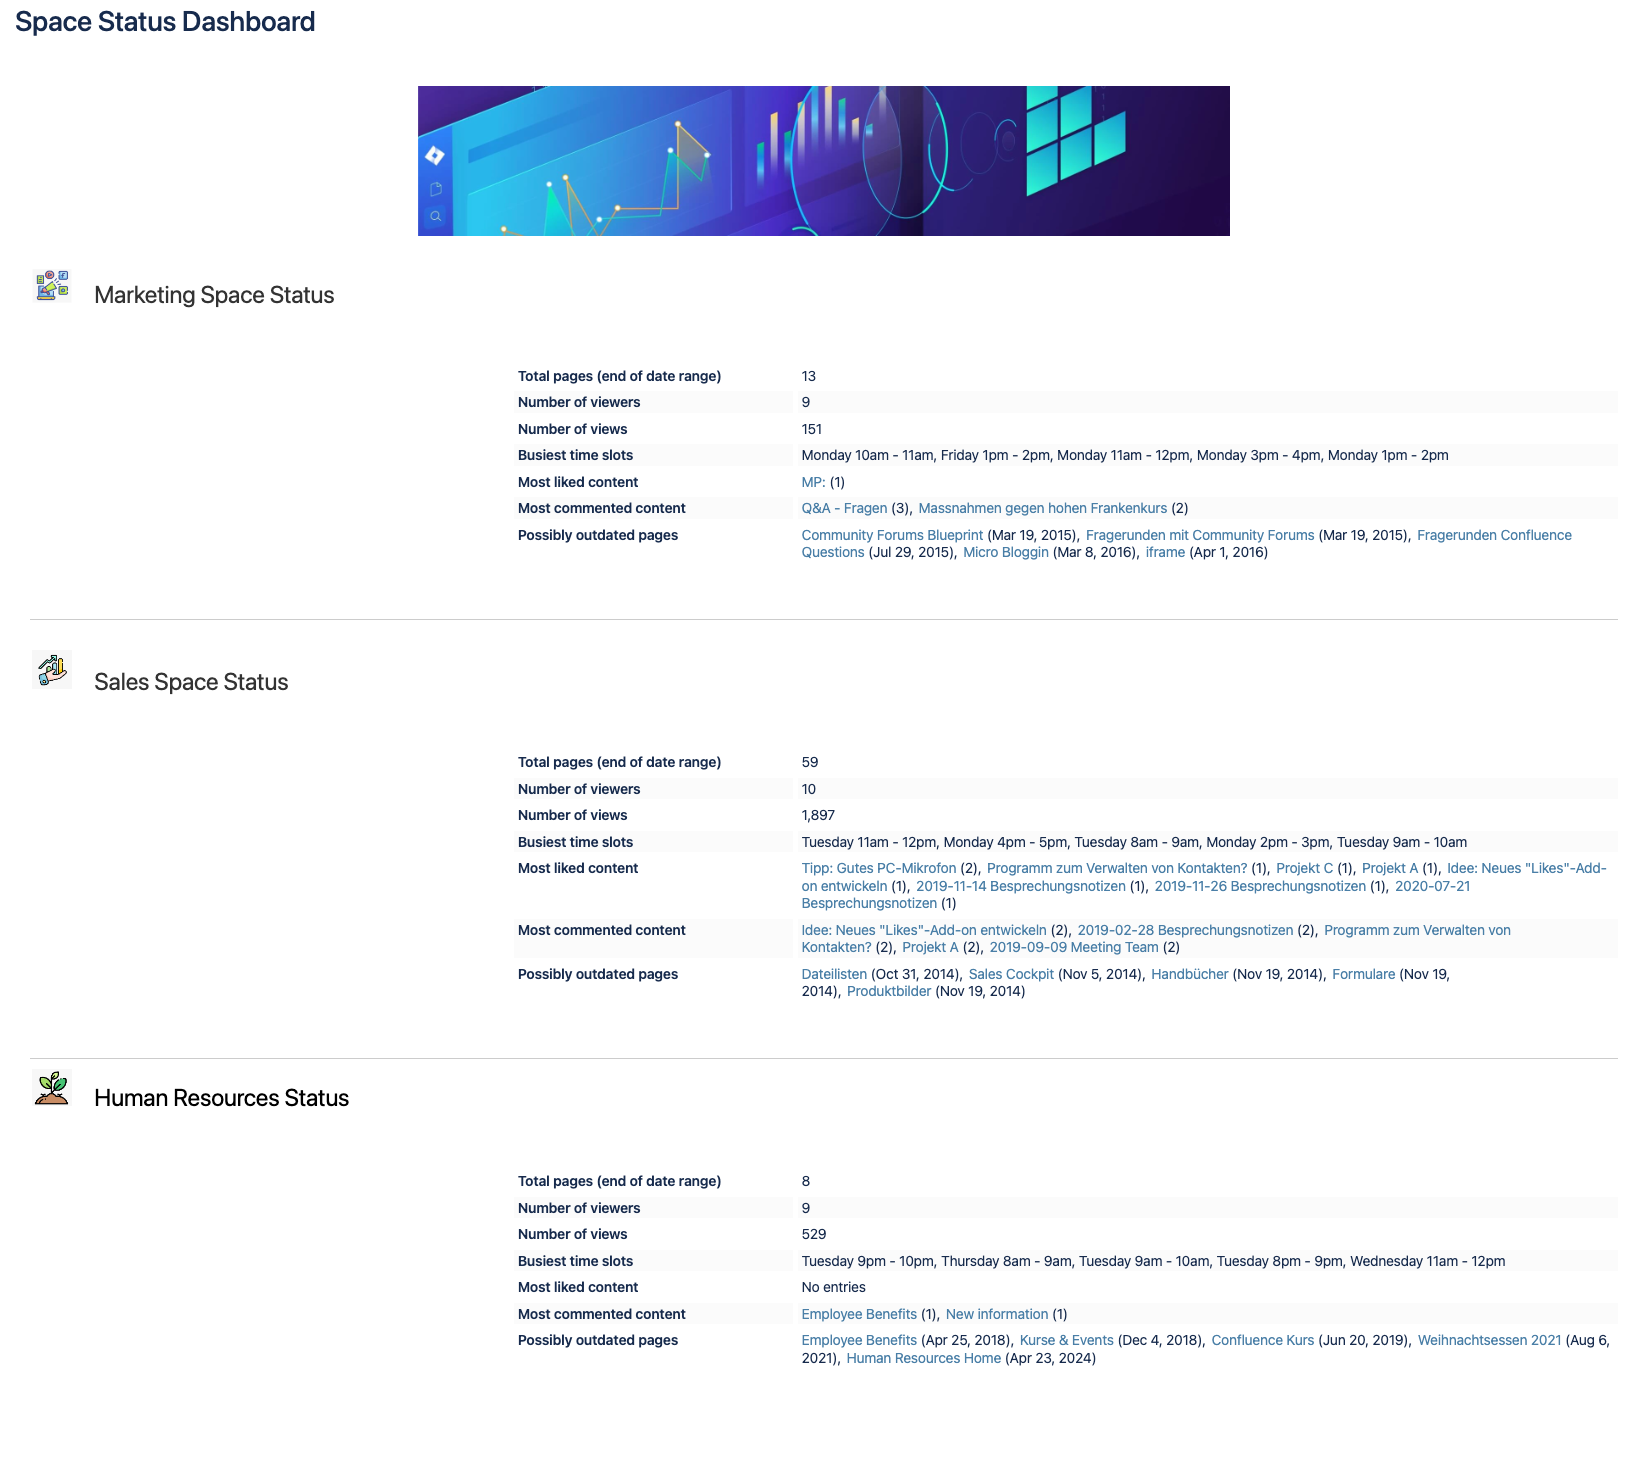
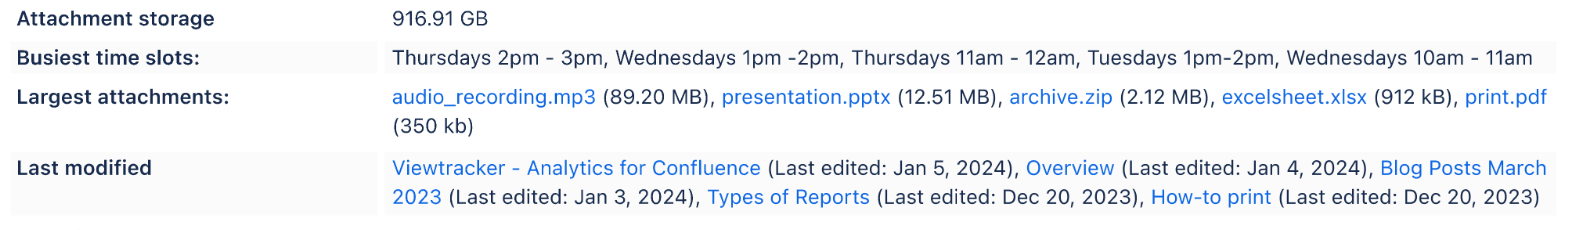
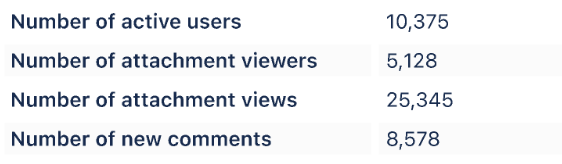
Result: The selected page or space metrics are displayed as a list.
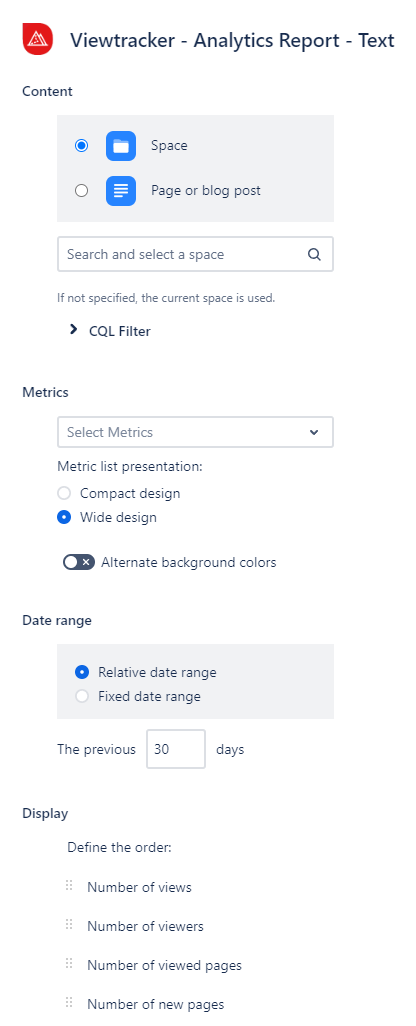
The general settings of this option
Content - You can select a space, a page, or a blog post. Use the CQL filter to refine the space selection further.
Metrics - These are the same as those in the Viewtracker Reports (see the expansion below).
You can define the number of items displayed per metric (where the metric allows it. e.g., attachments).
Metric presentation: You can present the list in a compact or wide design.
Alternate background colors: changes the background color of items to separate each metric.
Please note: Metrics differ if a Space or a Page is defined.
Attachment Storage
Busiest time slots
Largest attachments
Last modified
Last viewed
Most commented content
Most edited content
Most viewed attachments
Most viewed pages and blog posts
Newly published
Number of active users
Number of attachment viewers
Number of attachment views
Number of content created
Number of content deletions
Number of contributors
Number of edits
Number of engaged users
Number of new attachments
Number of new blog posts
Number of new comments
Number of new pages
Number of viewed attachments
Number of viewed blog posts
Number of viewed pages
Number of viewers
Number of views
Possibly outdated pages
Top commentators
Top contributors
Top viewers
Total attachments (end of date range)
Total blog posts (end of date range)
Total pages (end of date range)
Date Range - Two types of date ranges can be set:
Relative: The default setting. It will continually update itself to the previous day.
Fixed: Here, you can manually specify the start and end date of the report.
Display - Define the order of the metrics to display by drag and drop.
Examples of the text option


Examples & use cases
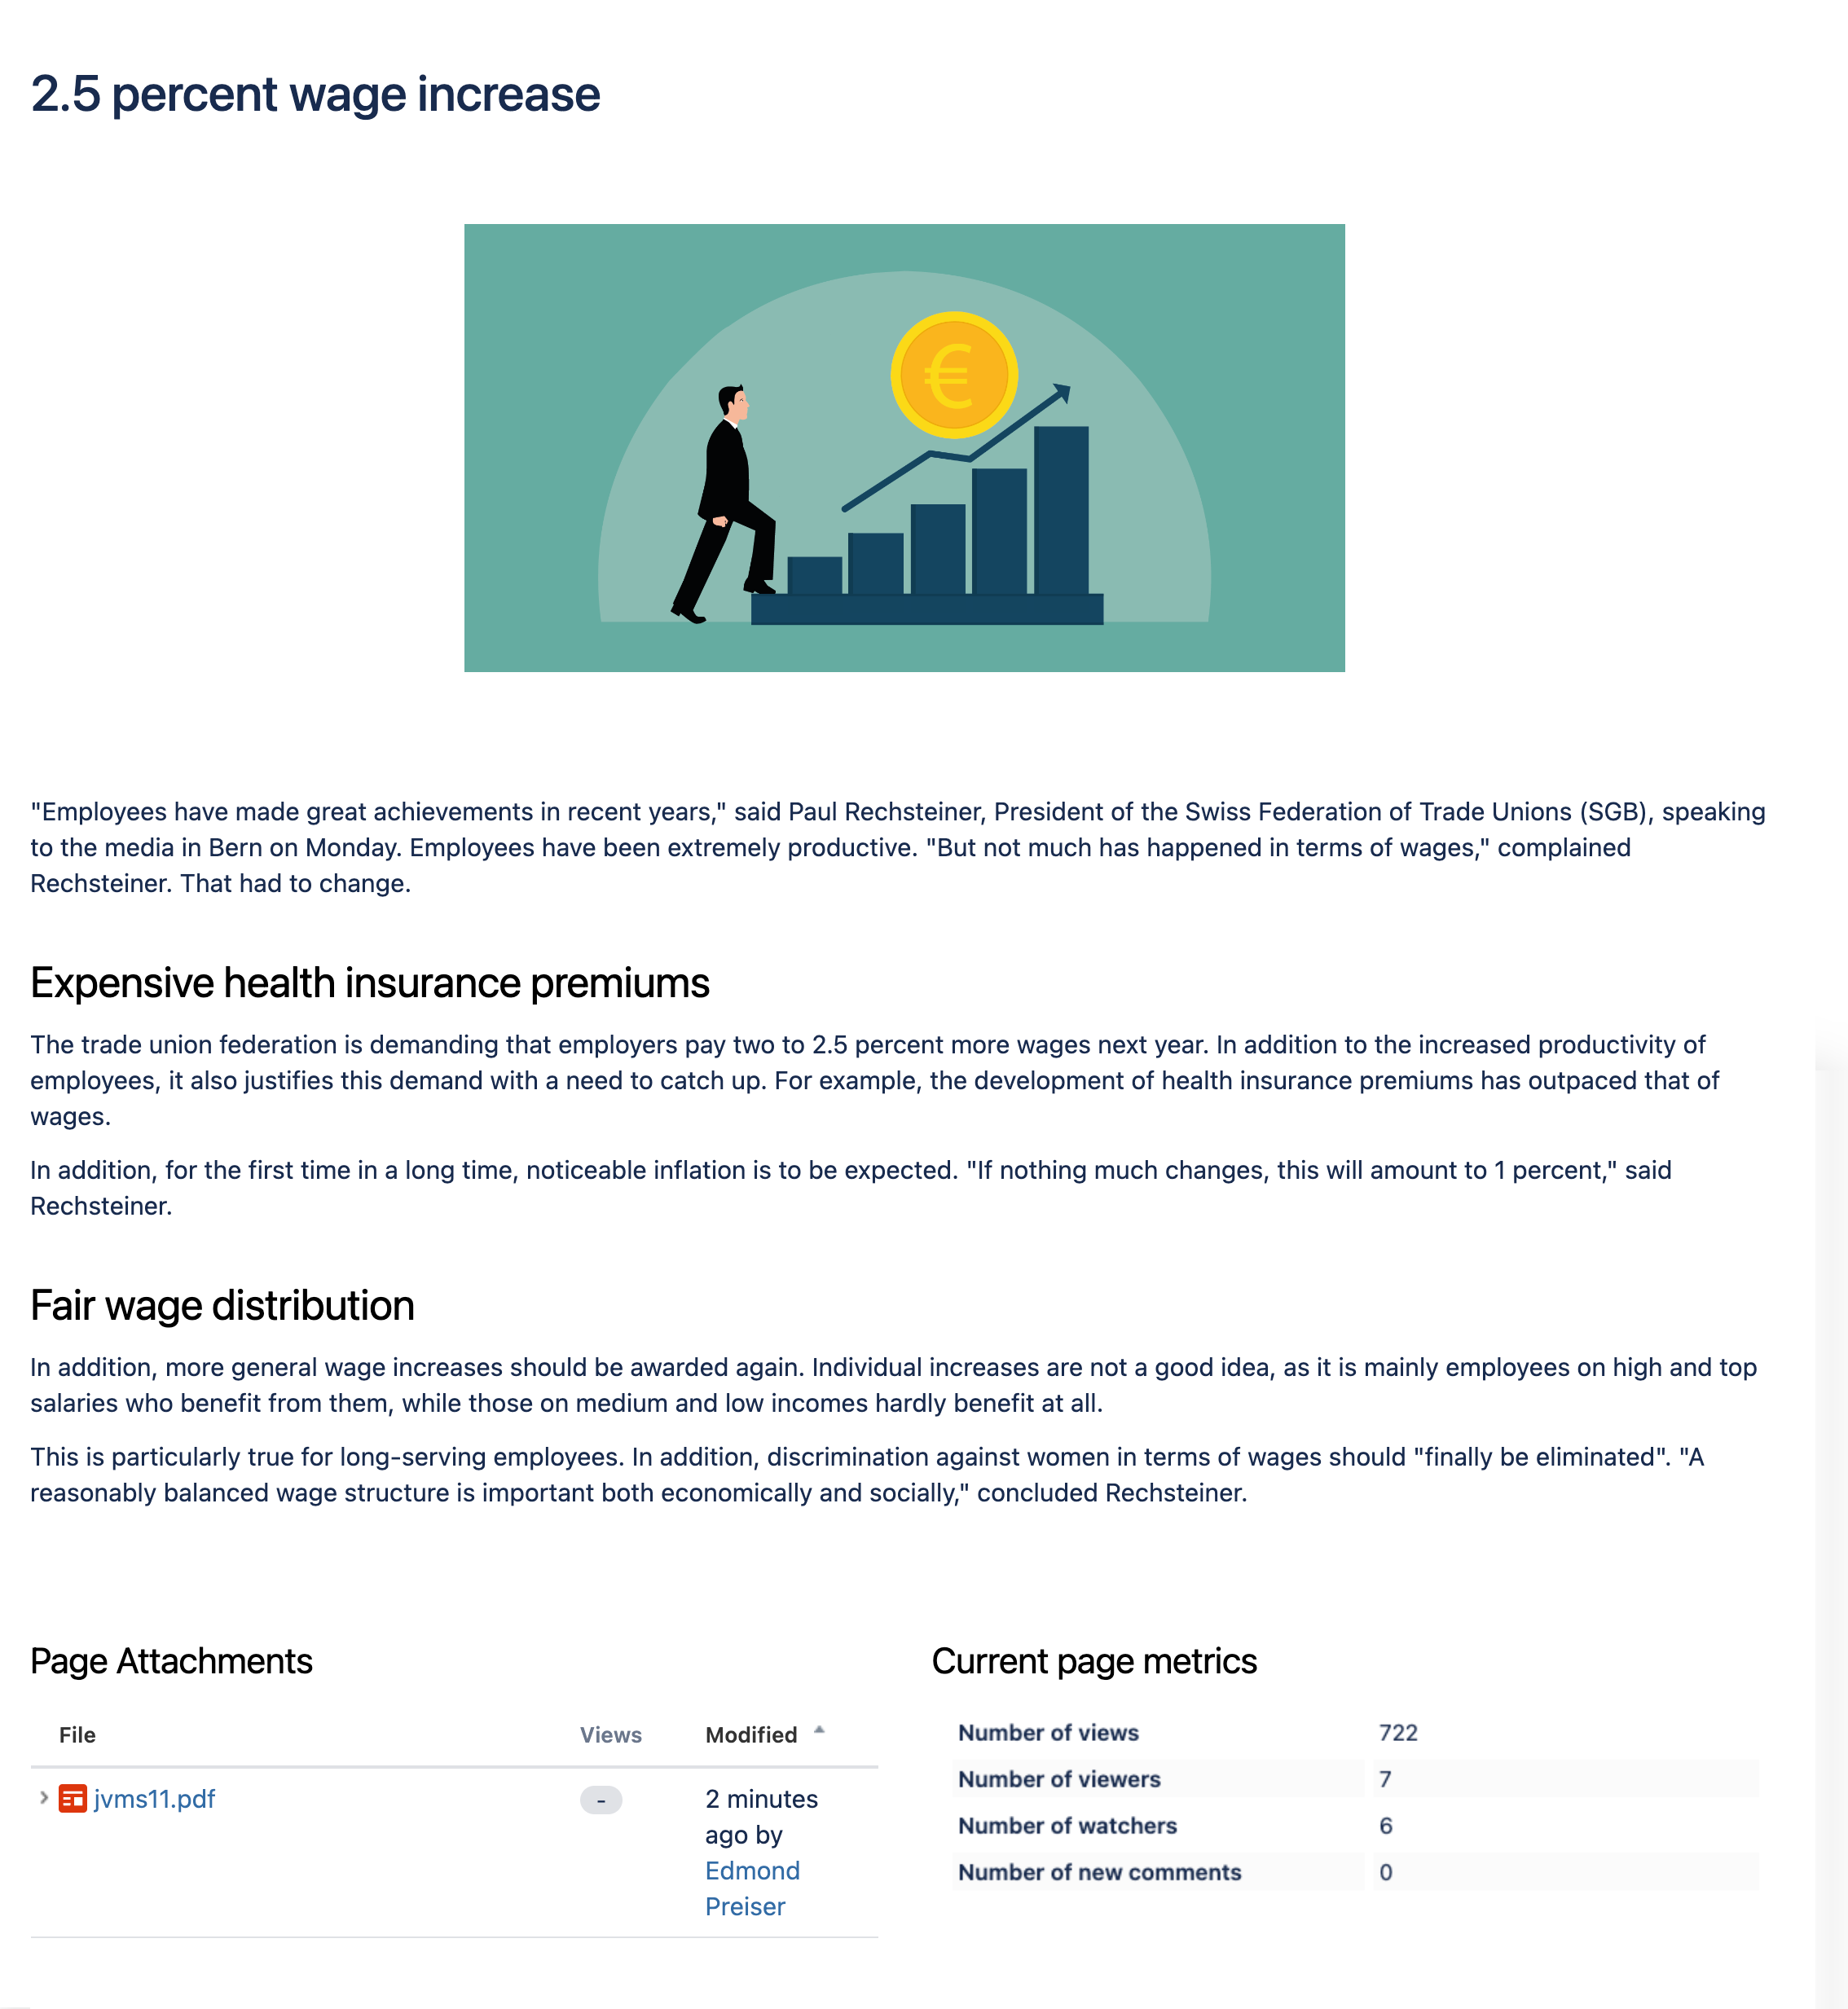
Example 1: Complementing News & Reports
Would you like to release important news or a report?
Complement information with relevant content lists, user lists or key figures as text on specific topics and news.
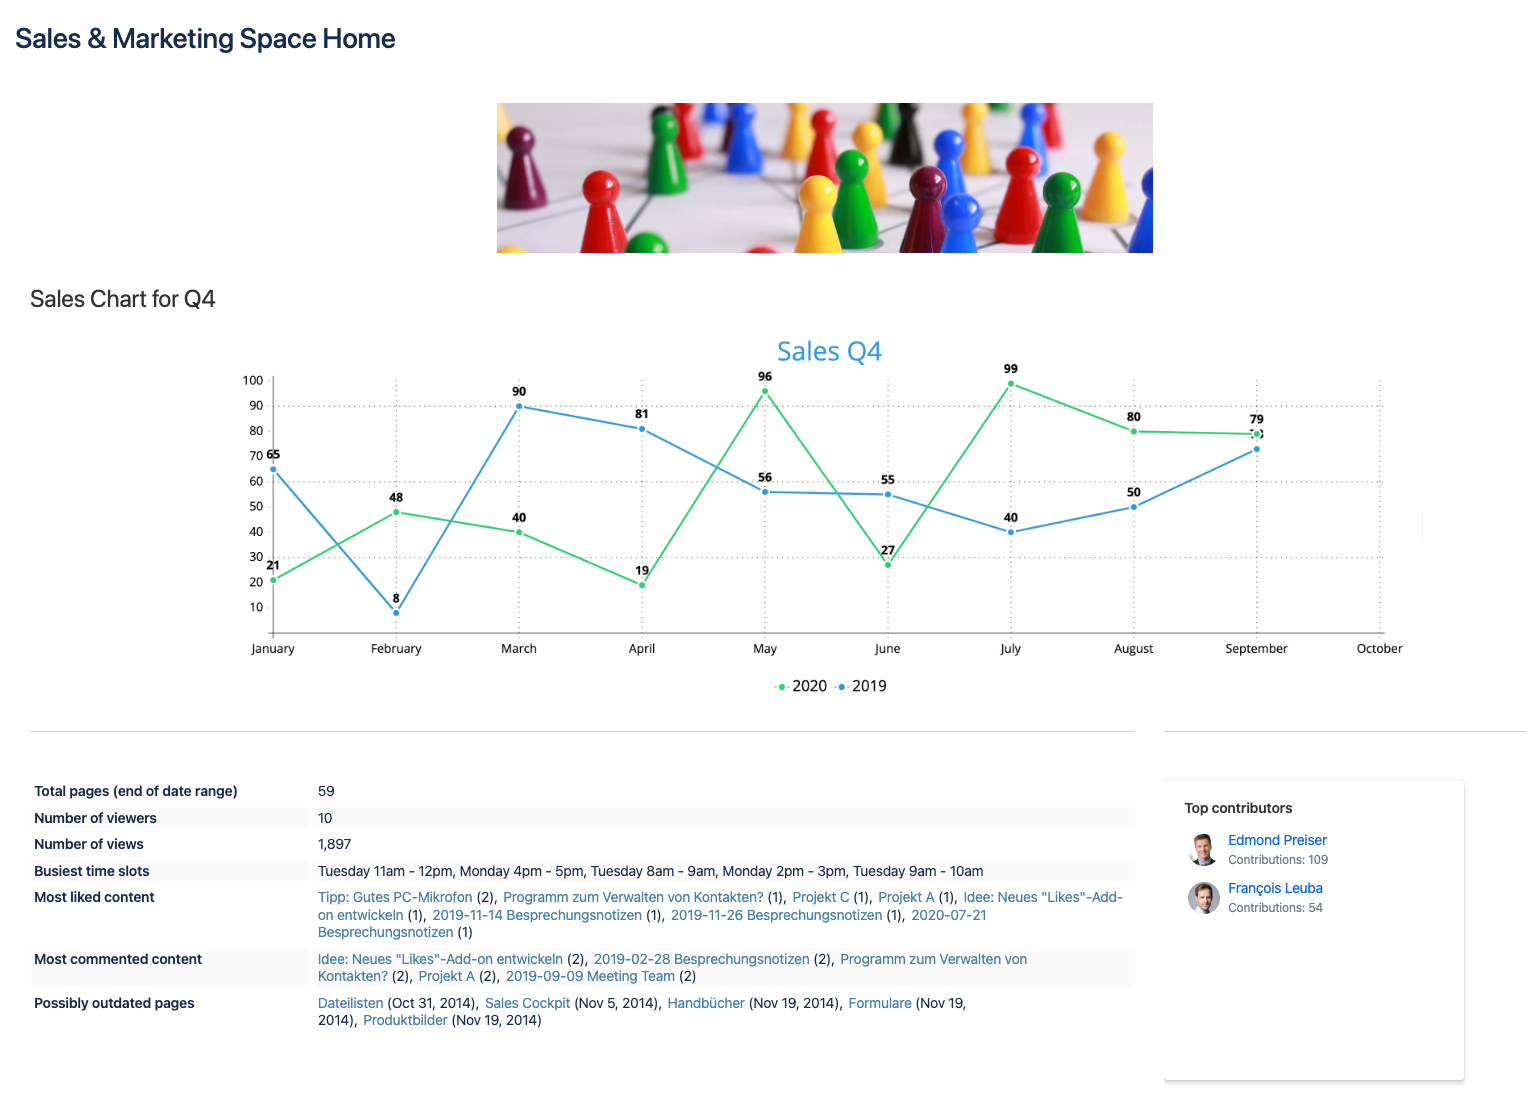
Example 2: To complement space information
Would you like to enrich your space's homepage with exciting information and key figures?
Complement your space home page with various lists and key figures.
Example 3: Compare the performance of different pages or spaces
Would you like to compare the performance and activities of different spaces or pages?
You can place a macro for each space with your desired lists and key figures. You can also define the same date range.