Analytics Report
This new macro expands the functionality of Viewtracker, allowing the display of metrics within Confluence pages.
Analytics Report - Use Cases
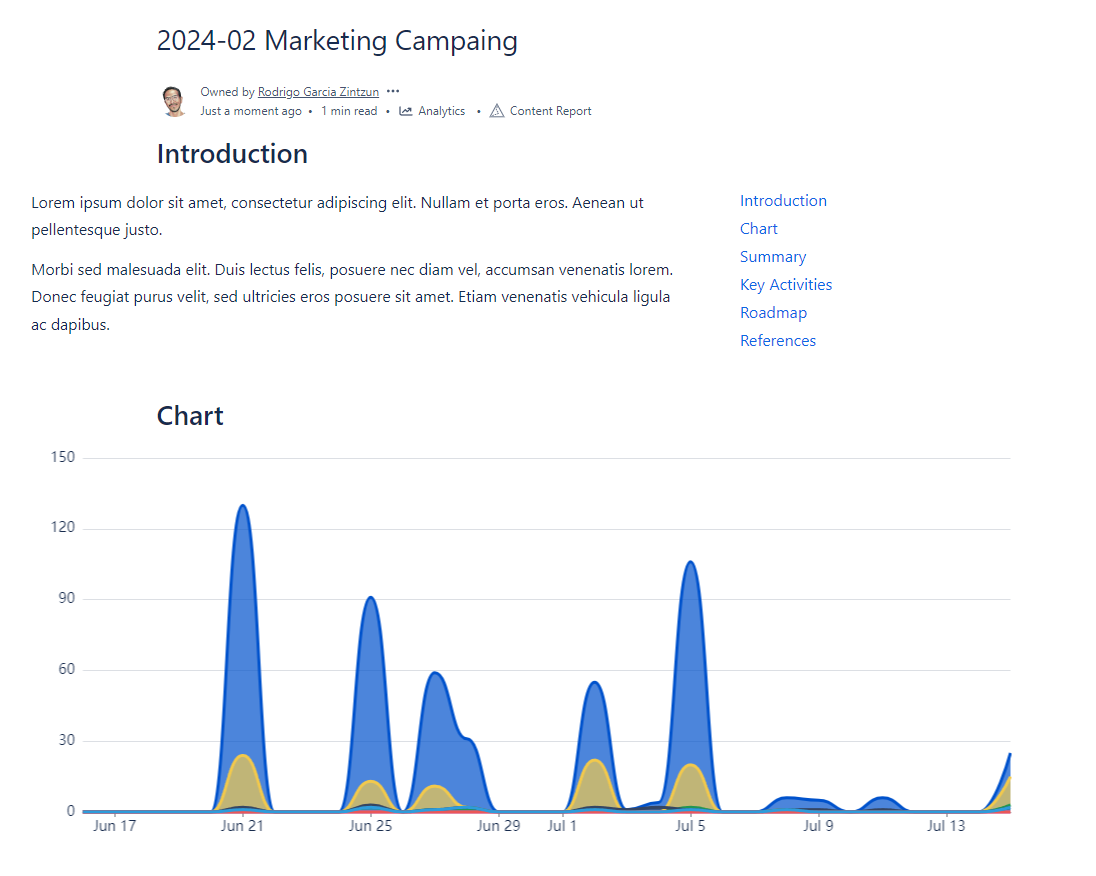
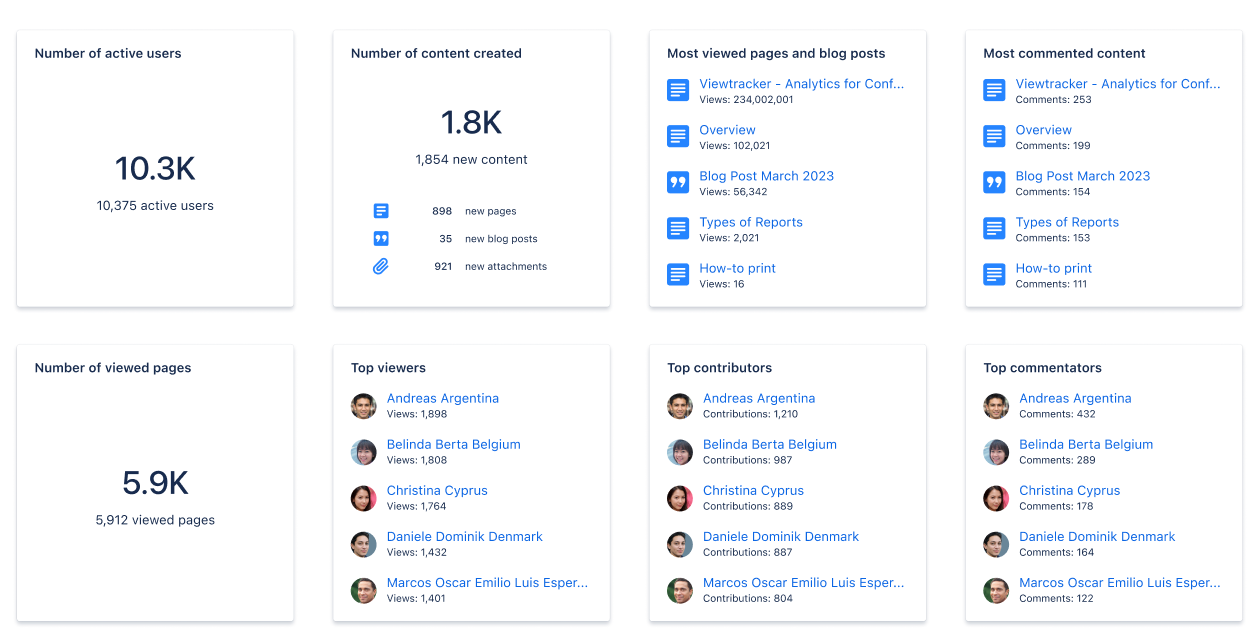
![]() With the Analytics Report macro, you can share data about pages or spaces and display it within your Confluence pages.
With the Analytics Report macro, you can share data about pages or spaces and display it within your Confluence pages.
🔐 The resulting data will comply with Viewtracker’s Data Privacy settings and Confluence’s space and content permissions. This means:
If Data Privacyallows it, page visitors will see Top Viewers / Users.
Viewers will still require the appropriate permission to view the listed content of the specified space.
Using this macro
To use this macro, simply type /Analytics Report and select the “Analytics Report“ macro. This will open an initial welcome page where you can choose how to present the Viewtracker data: as a chart, tiles or lists.
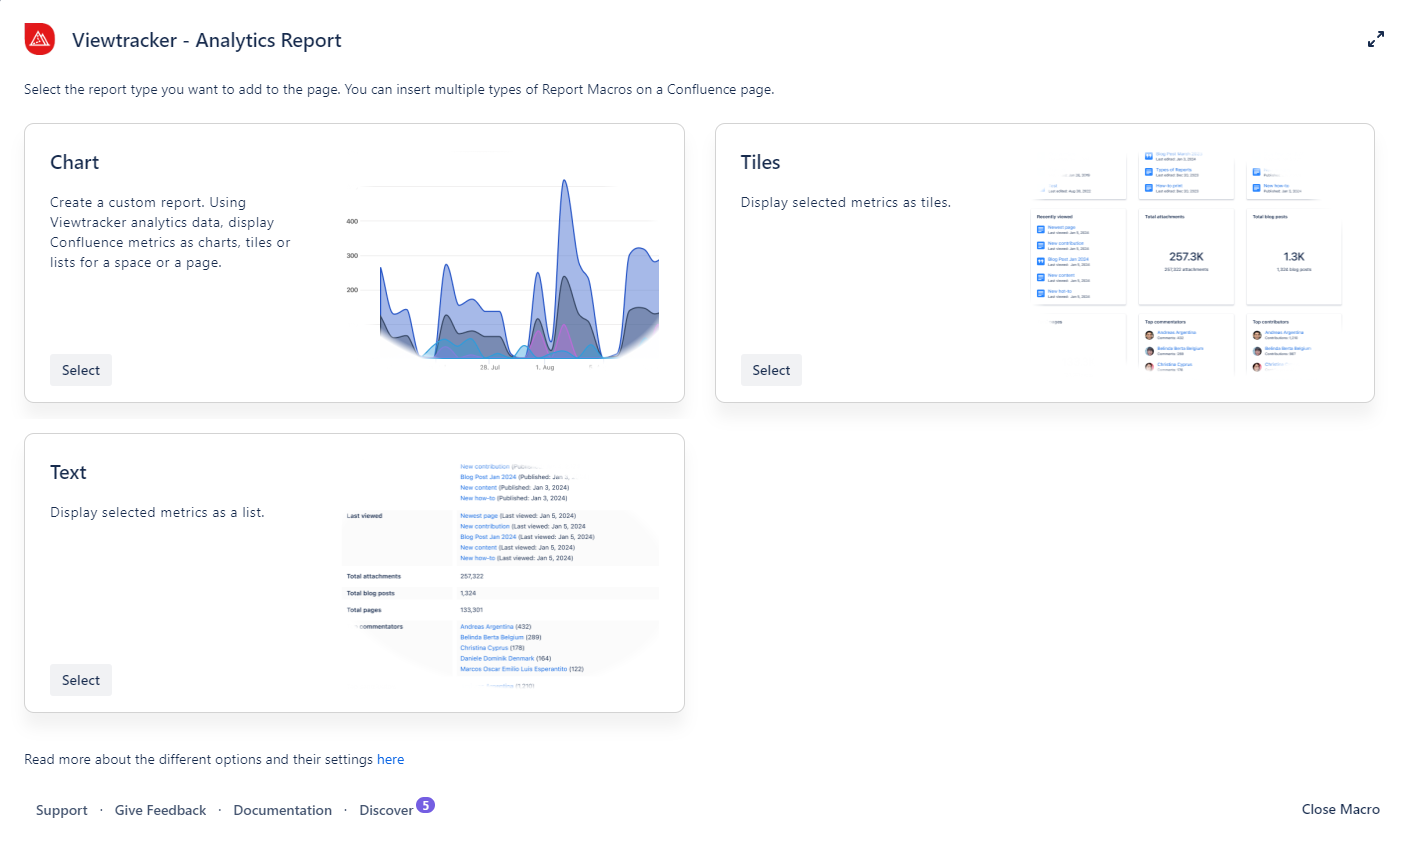
Options in the Analytics Report
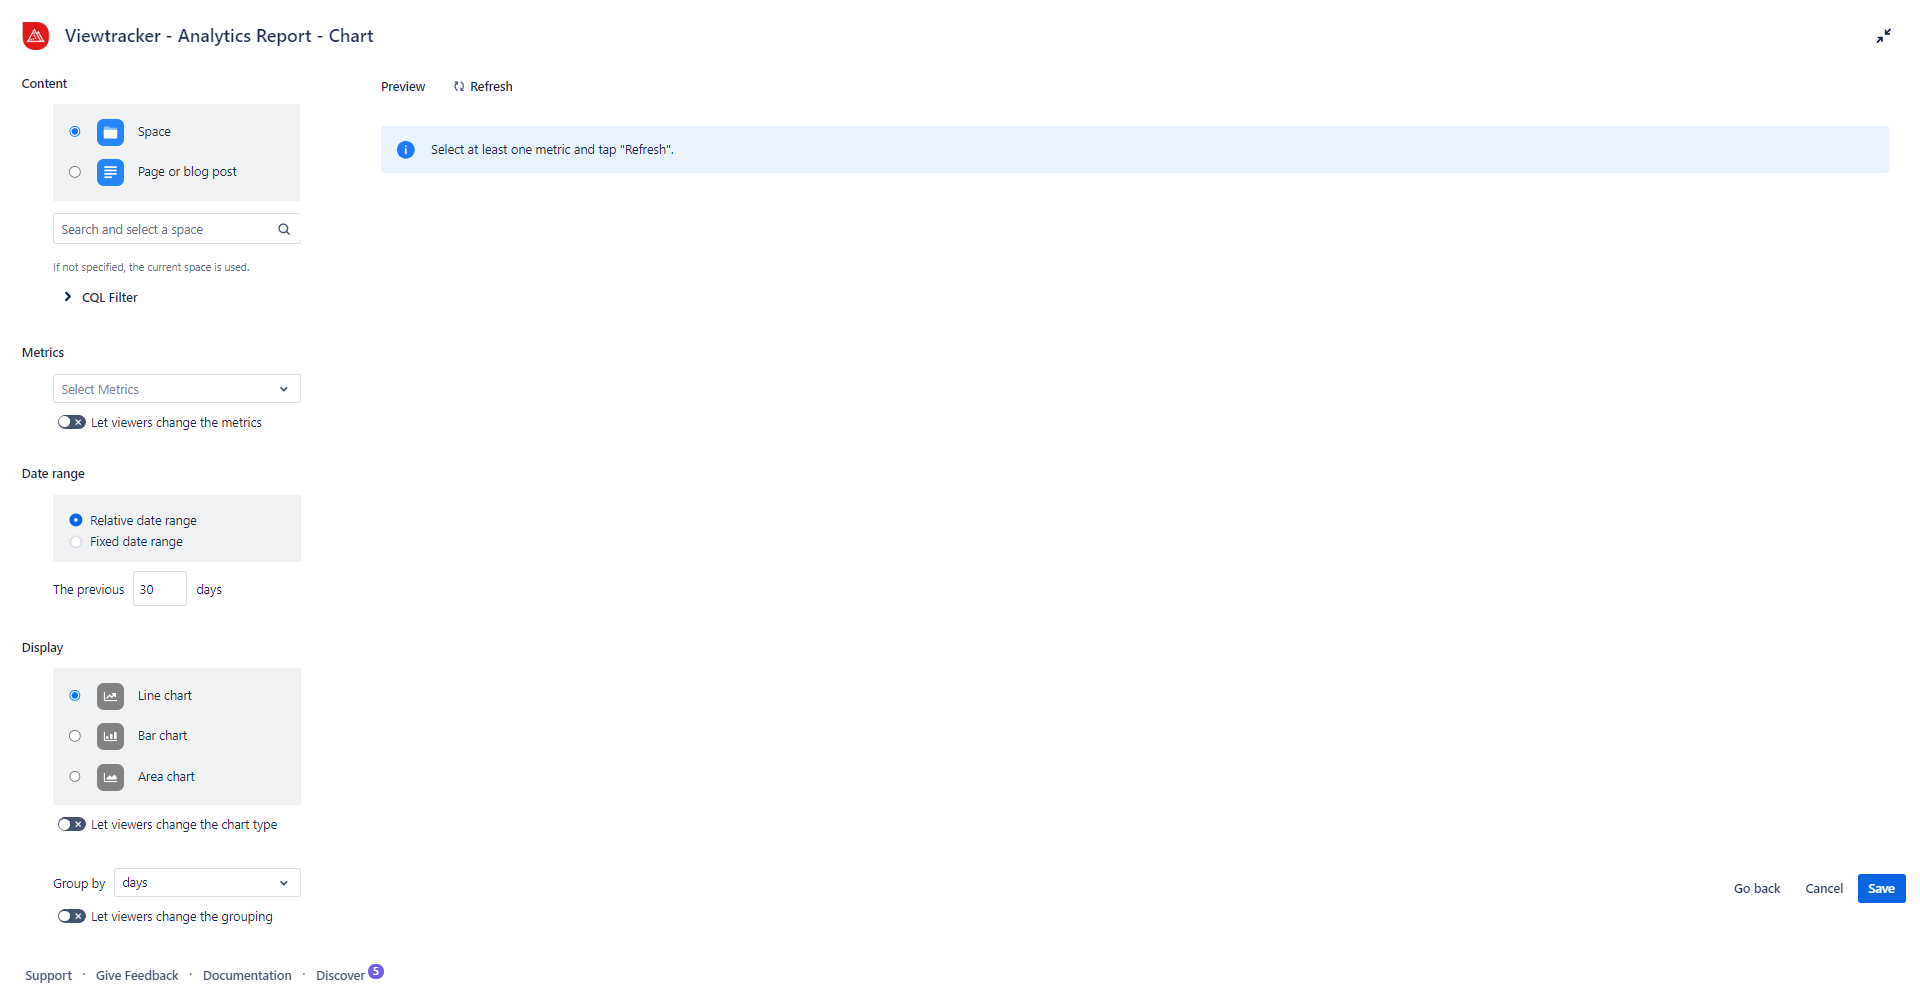
Chart
What can this option do?
With this option, you can display tracked metrics (e.g., likes, views, comments) in a Line, Bar or Area Chart.
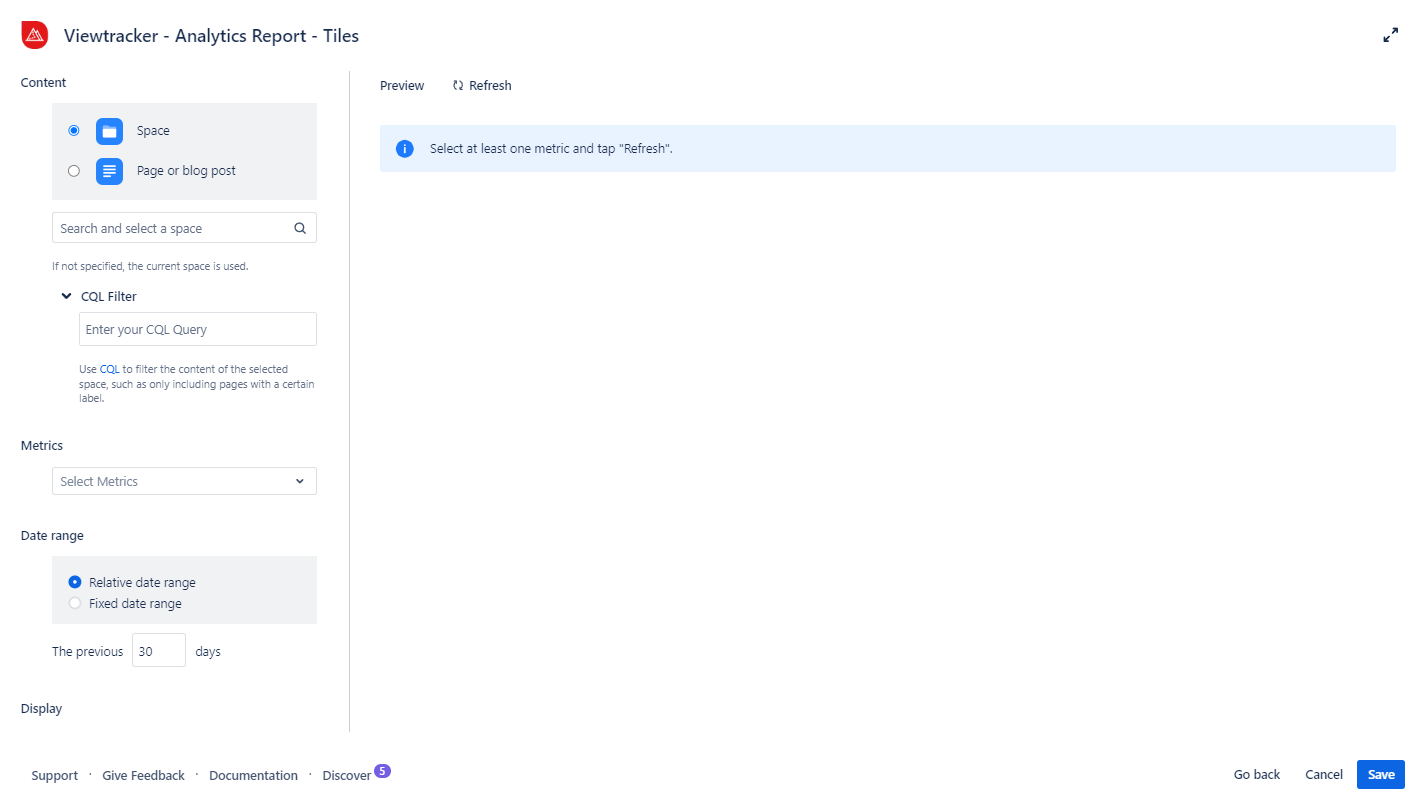
Tiles
What can this option do?
This option allows you to display metrics in the shape of tiles. It is suitable for presenting pages or space data.
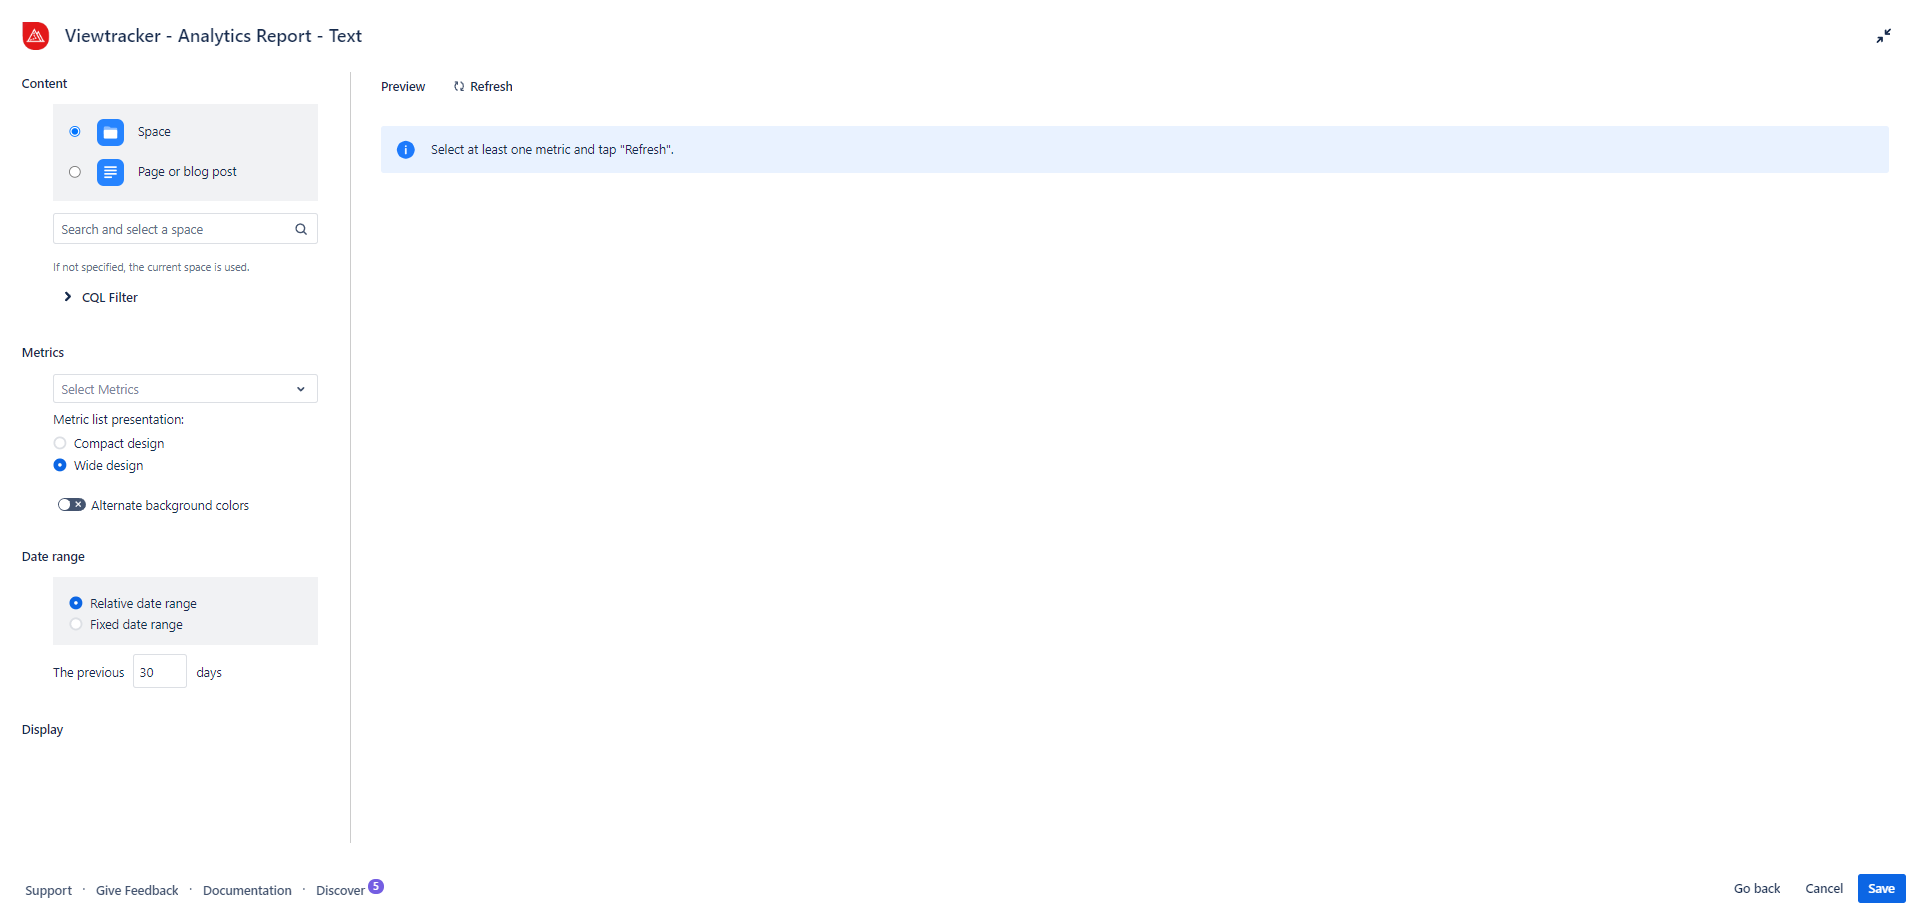
Text
What can this option do?
This option allows you to display metrics in a more textual manner. Present your Confluence page or space data as lists.
Pre-filled macros
These macros are already pre-filled with some metrics. Users can customize it by changing styles or adding or removing said metrics.
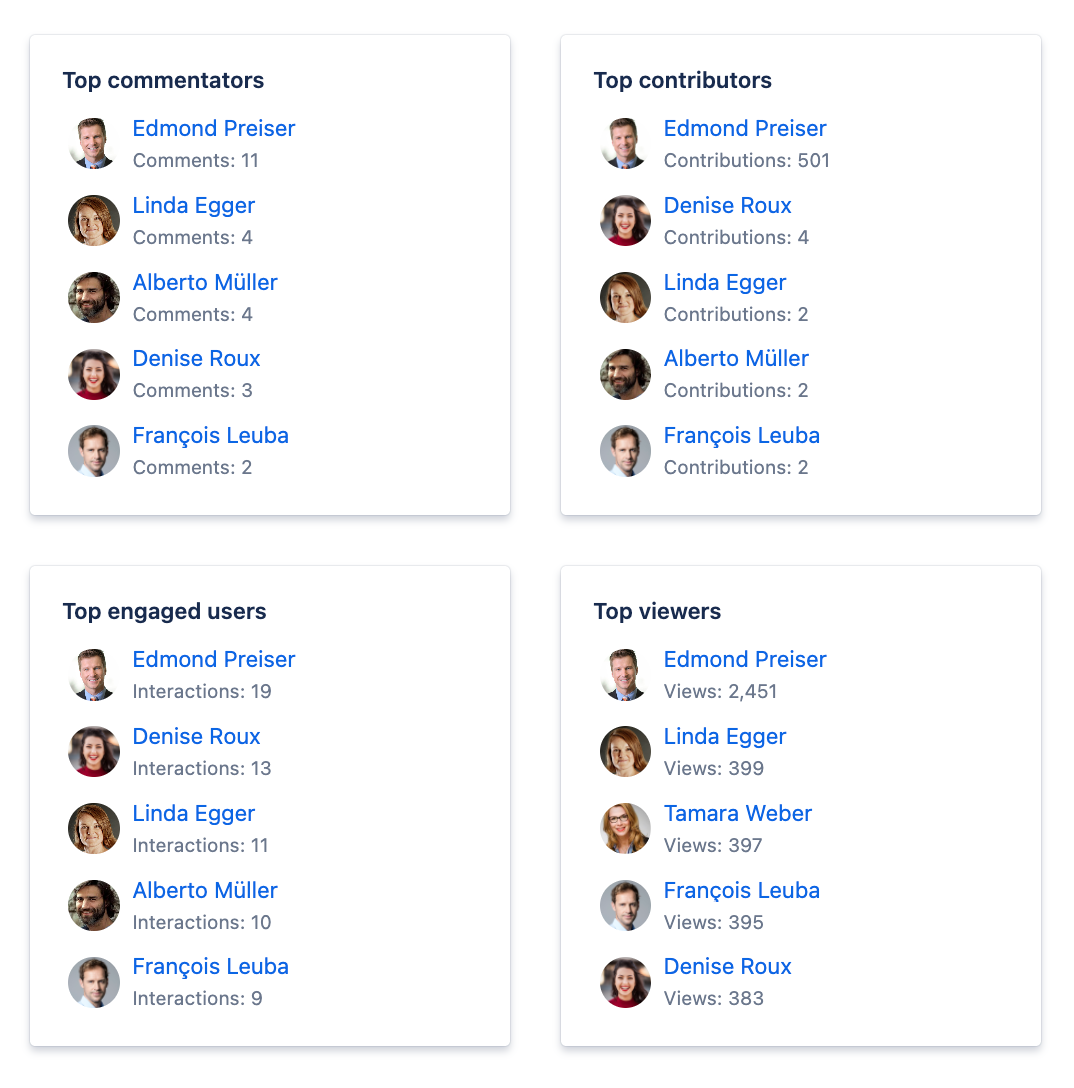
Top Users
What can this macro do?
With this macro, you can simplify your workflow: Choose a display option, Tile or Text, and showcase your top users.
It contains:
Top viewers
Top Contributors
Top commentators
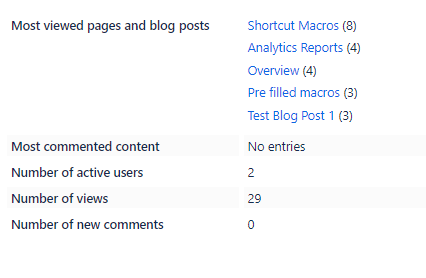
Popular Content
What can this macro do?
This macro can help you highlight the popularity of your content and display it in tiles or list form.
It contains:
Most viewed pages and blog posts
Most commented content
Number of active users
Number of views
Number of new comments
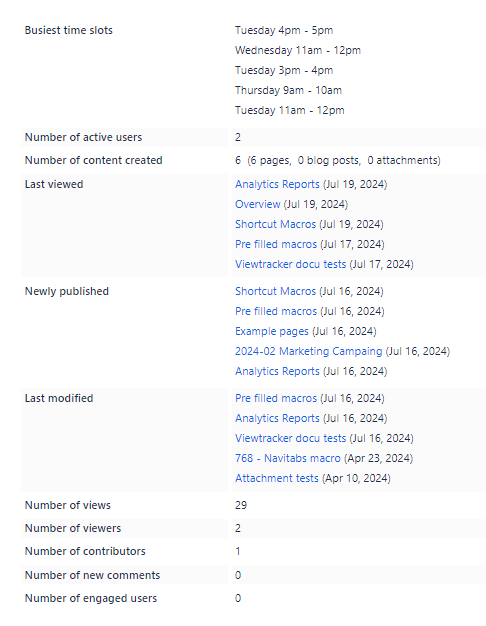
Content Activities
What can this macro do?
This macro helps highlight activity-related metrics of spaces or pages.
It contains:
Busiest time slots
Number of active users
Number of content created
Last viewed
Newly published
Last modified
Number of views
Number of viewers
Number of contributors
Number of new comments
Number of engaged users
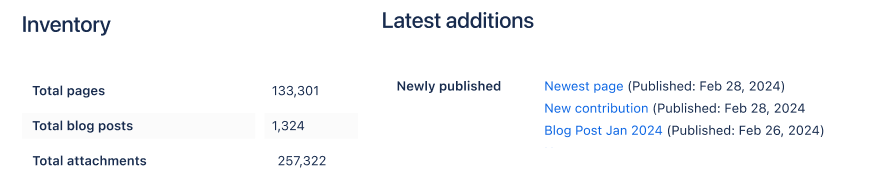
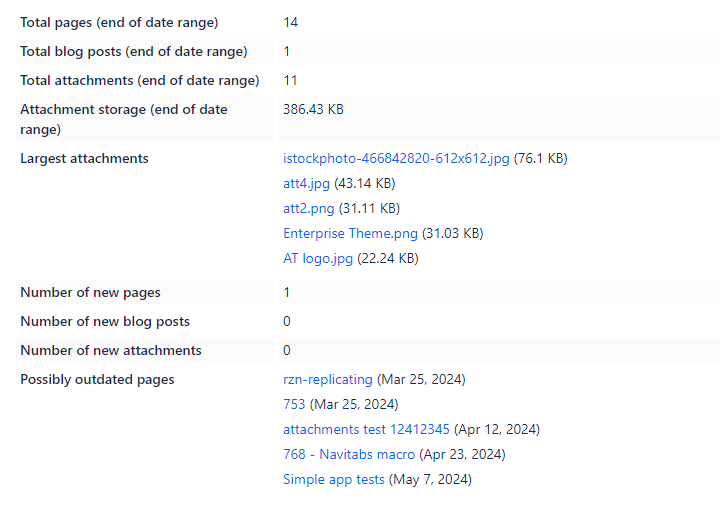
Content Inventory
What can this macro do?
This macro will display helpful metrics surrounding your instance.
It contains:
Total pages
Total blog posts
Total attachments
Attachment storage
Largest attachments
Number of new pages
Number of new blog posts
Number of new attachments
Possibly outdated pages
Shortcut Macros
These "shortcuts" are macros that will be empty upon placement and ready to be customized with your desired metric.
Analytics Chart
What can this macro do?
This shortcut will place the empty Chart option, ready to be customized with any of these metrics.
Analytics Tiles
What can this macro do?
This macro shortcut will place an empty Tiles option, which you can customize with metrics.
Analytics List
What can this macro do?
This shortcut will place an empty Text option, ready to be customized with metrics.
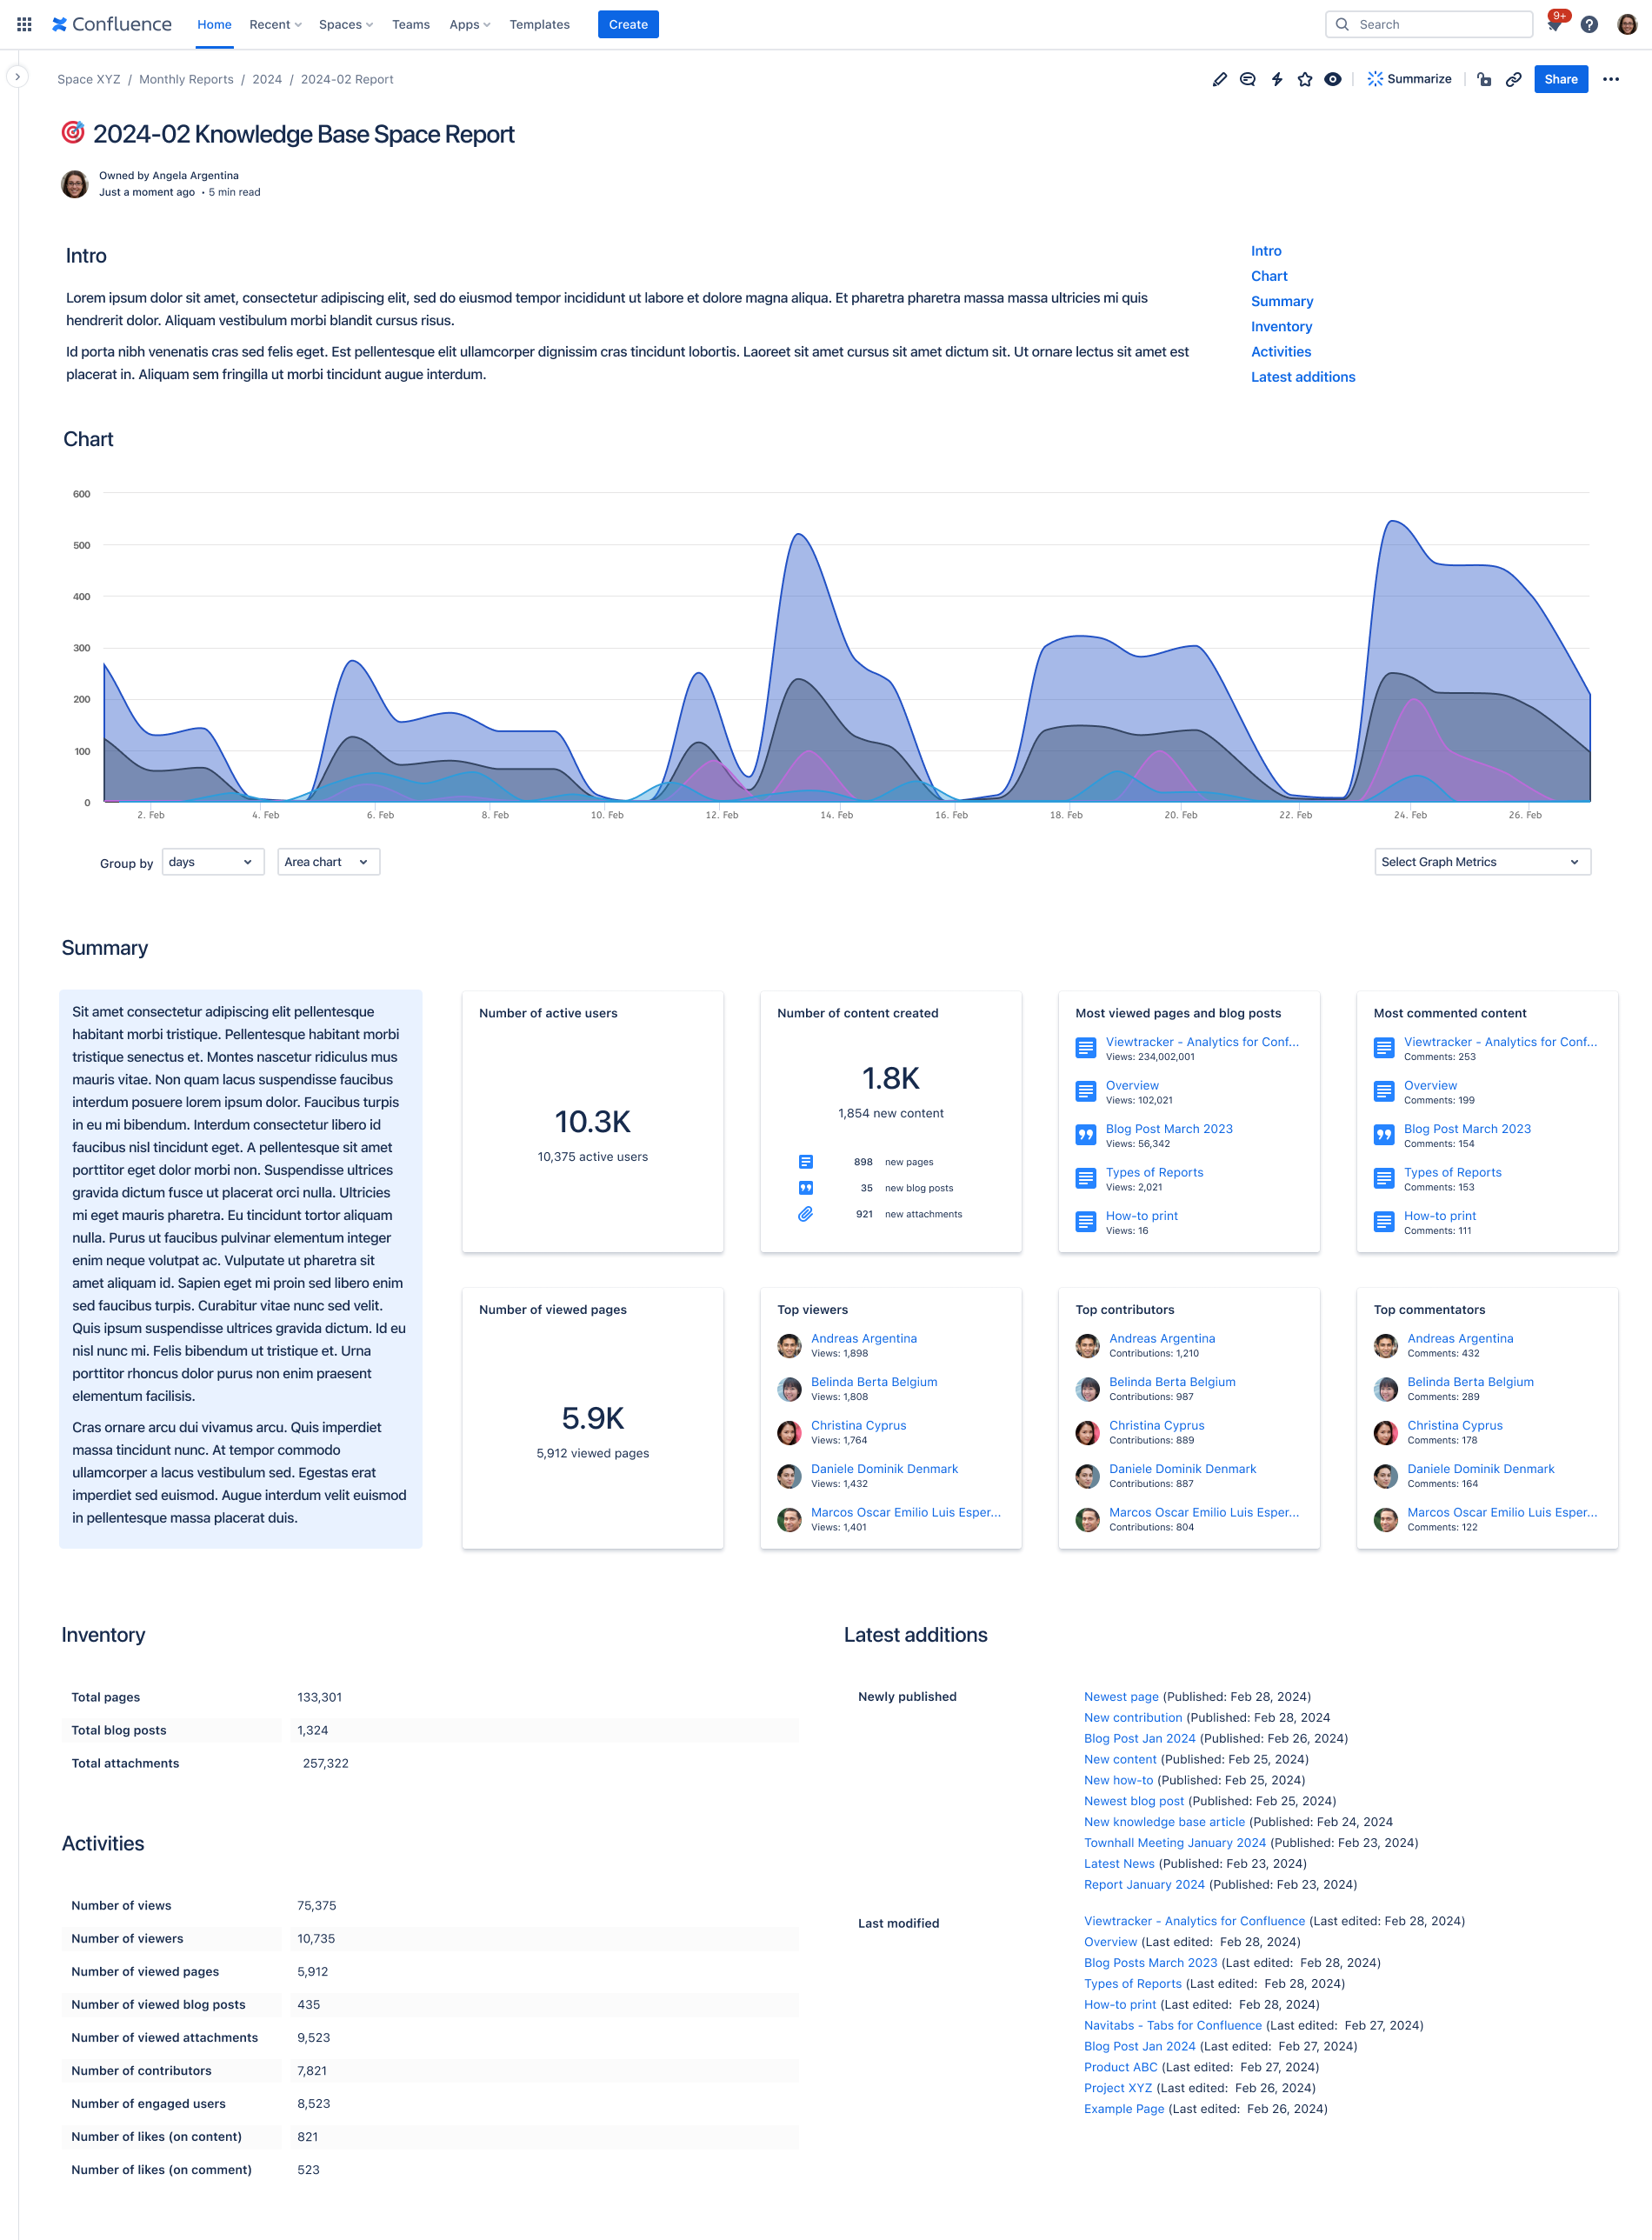
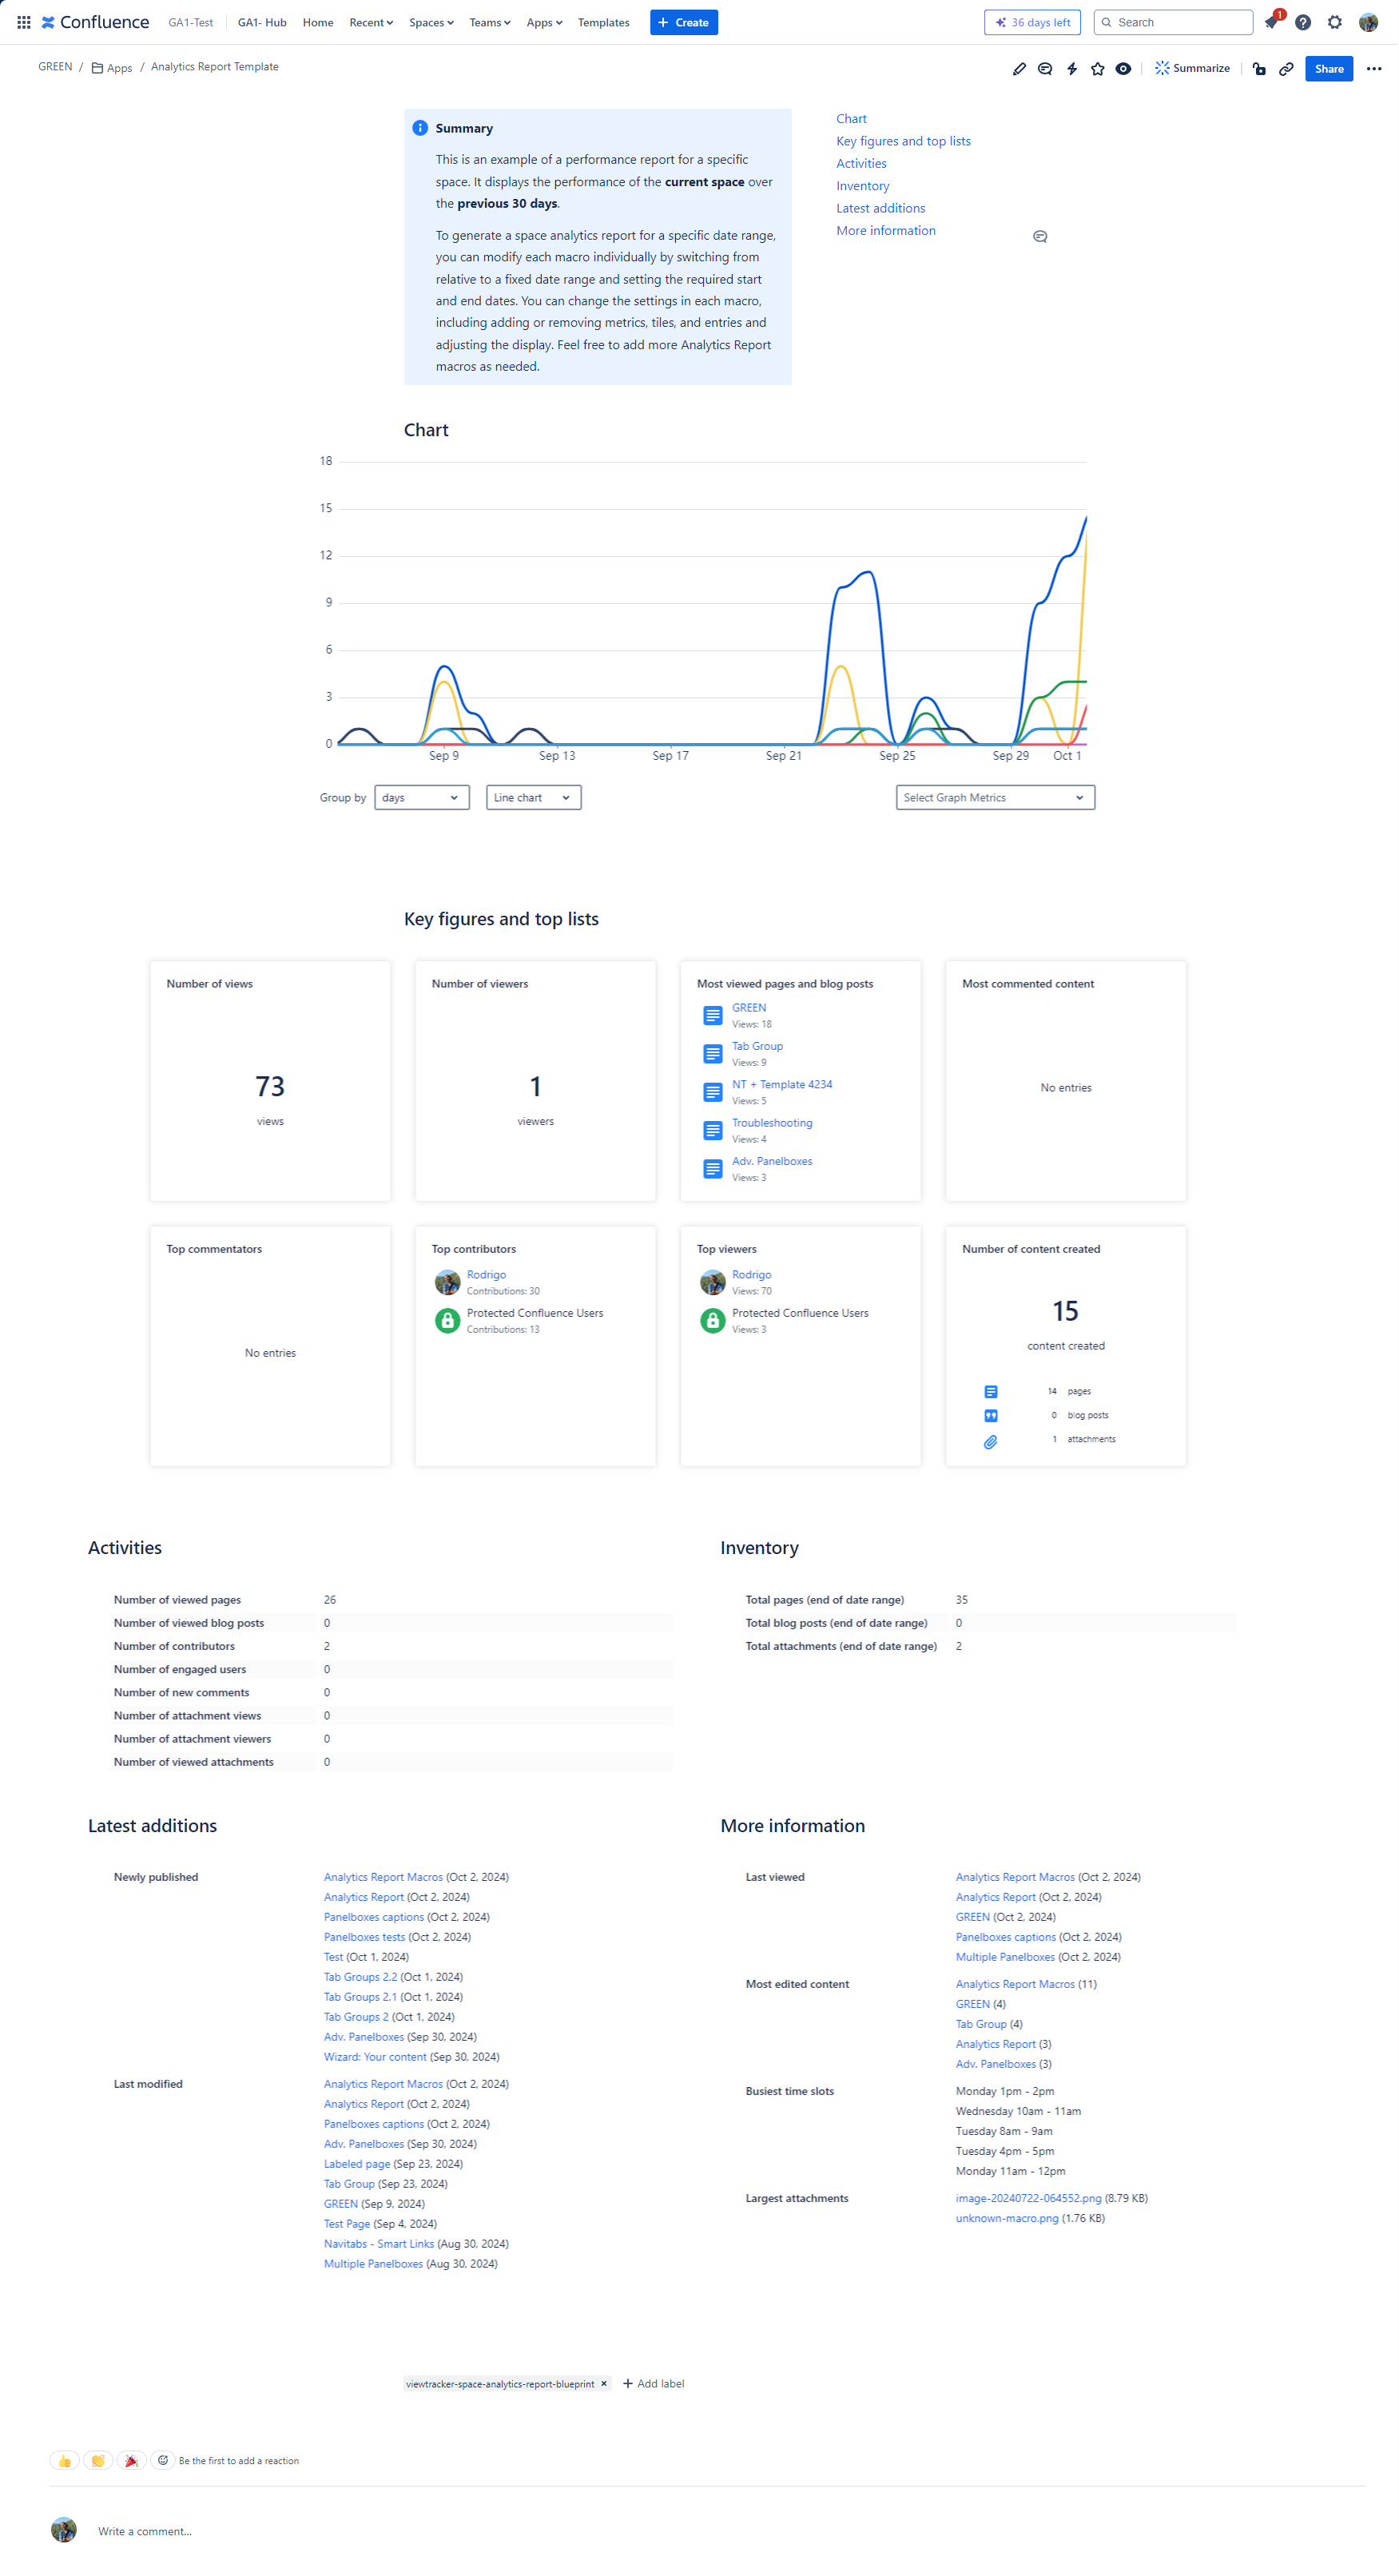
Page template: Space Analytics Report NEW
With this template you can generate a Confluence page with key space metrics.
How to use the template?
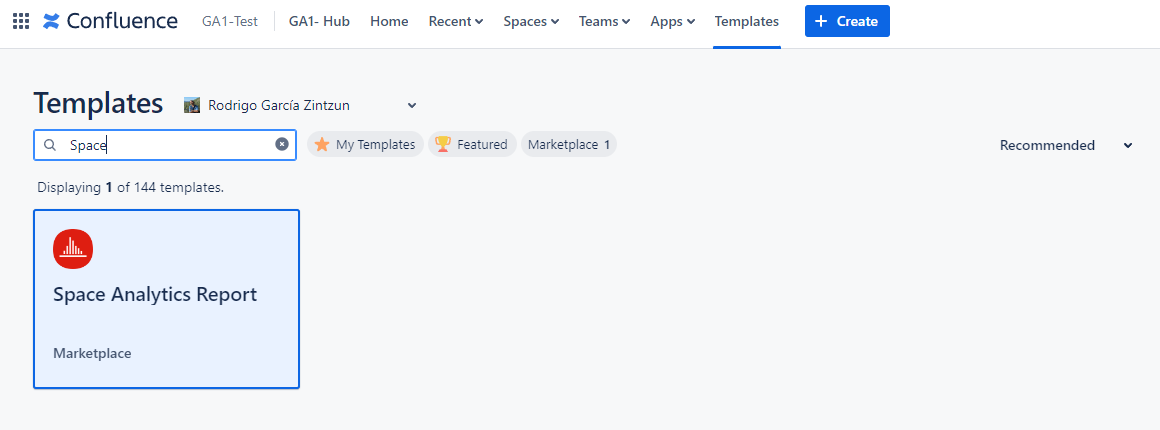
Head to the templates menu on Confluence’s navigation bar.
Search for the Space Analytics Report template and select it.
This template will create a Confluence page containing the data of your desired Space (defined next to the “Templates“ section) for the 30 days preceding the reader's visit.
Adjust the space selection, date range, metrics, KPIs, and top lists to meet your needs in each macro.
Publish the page.