Content & Usage Report: Users
List users and their interactions in your Confluence instance in a specified date range.
Accessing the Users Report
This new report is part of the Global Report and the Space Report.
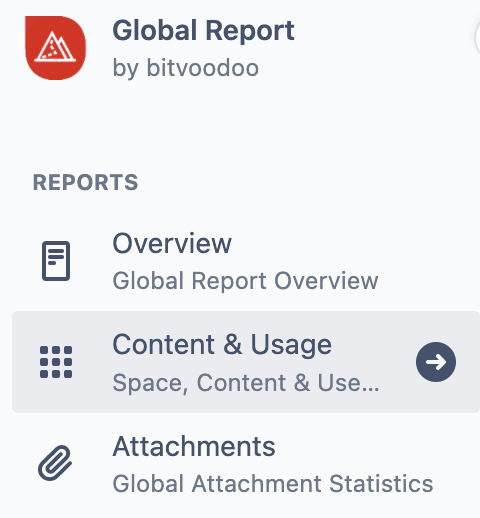
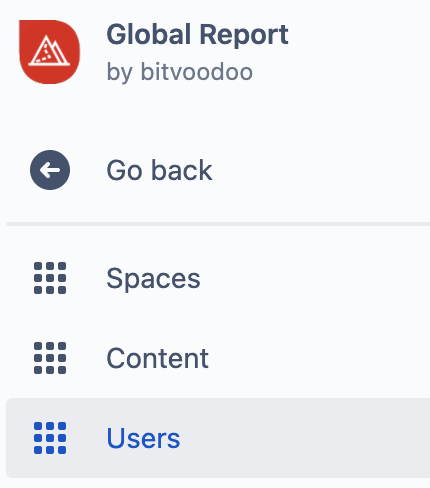
Access the global report via:
Apps → Viewtracker - Global Report → Content & Usage → Users or
⚙ → Viewtracker → Content & Usage → Users
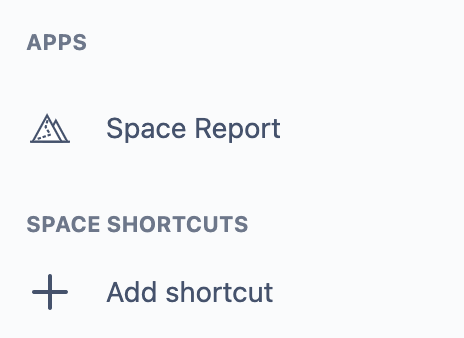
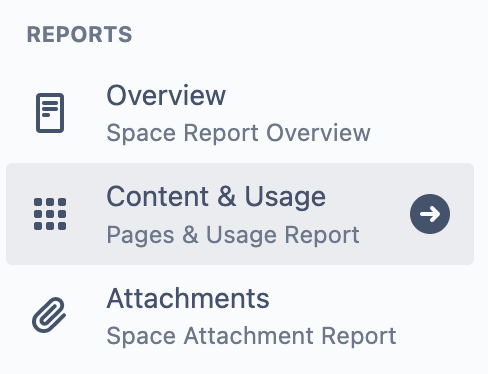
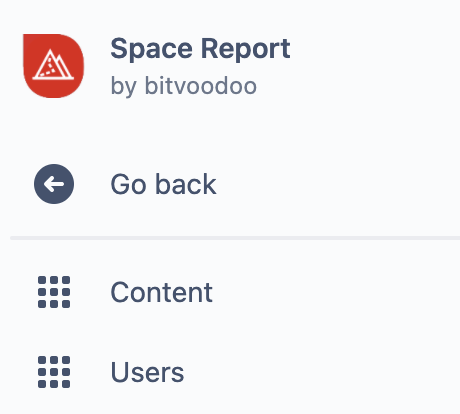
Access the report on a space level by viewing a specific space and selecting Space Report → Content & Usage → Users :
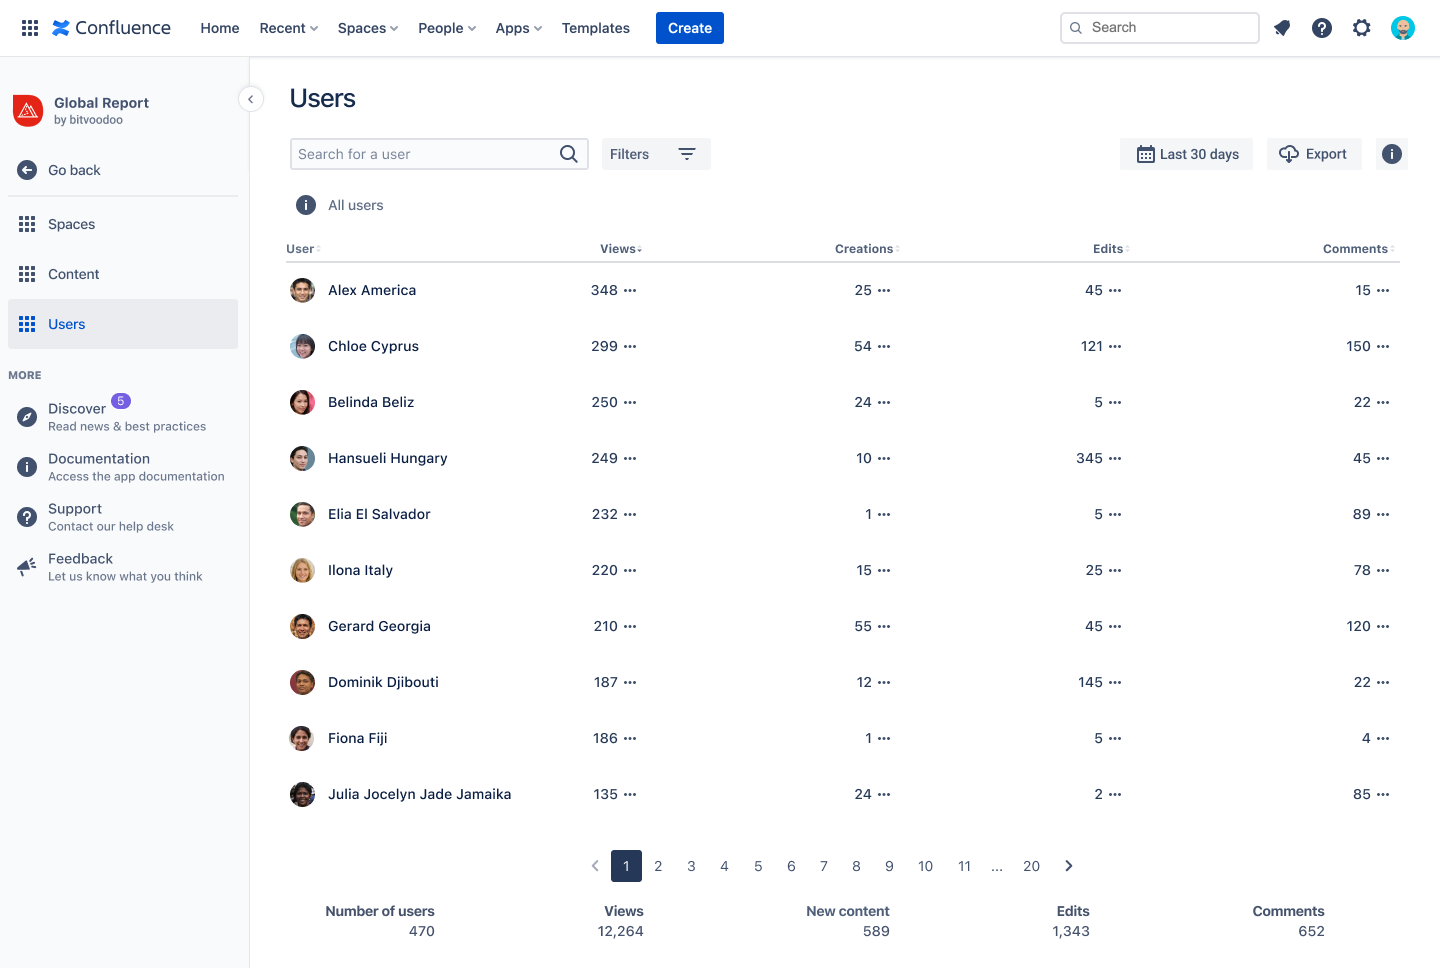
Users Report
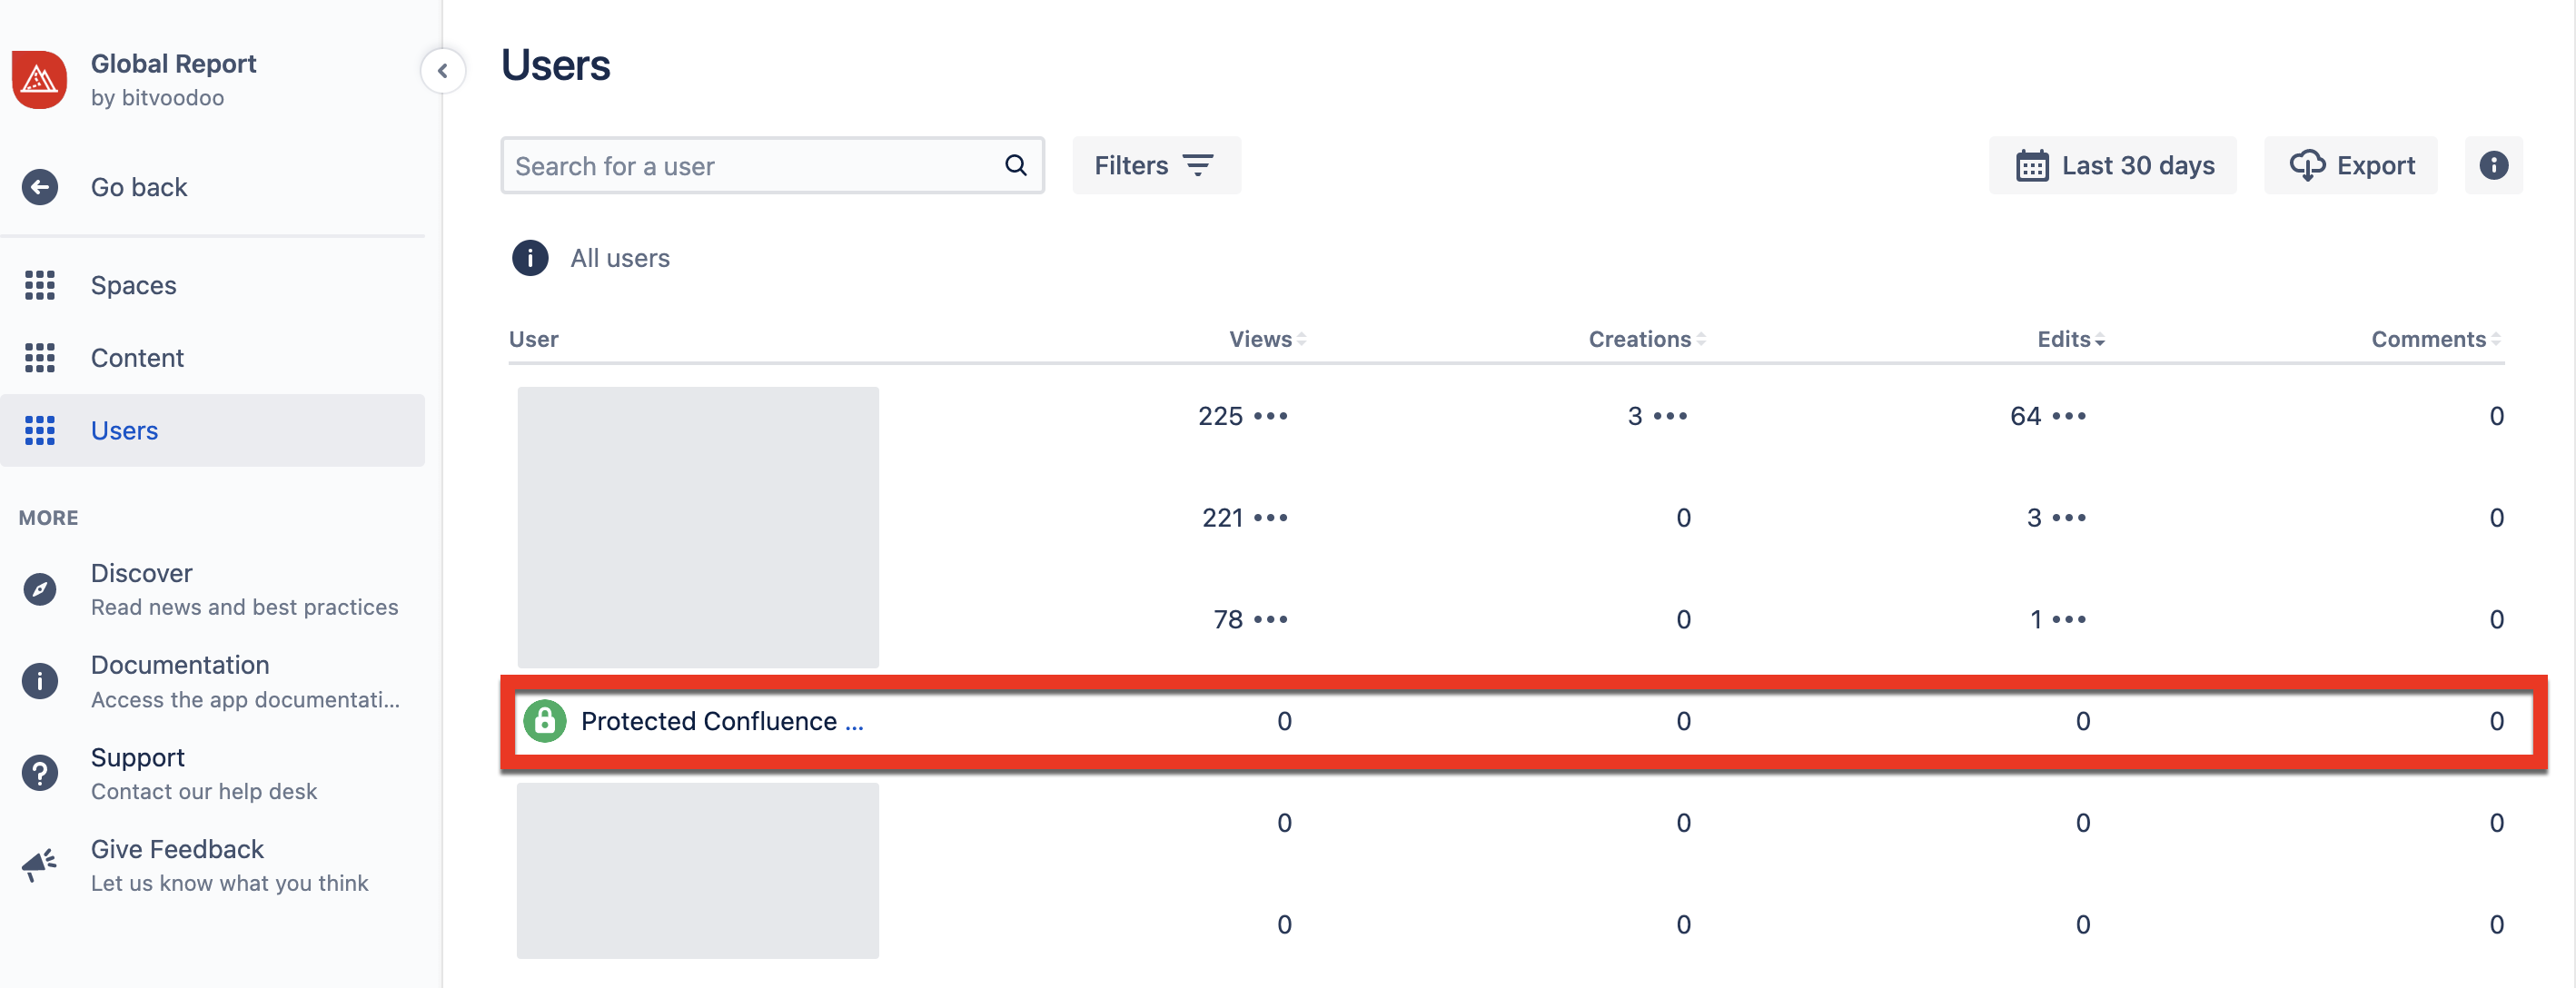
The main report is a table with the columns “User”, “Views”, “Creations”, “Edits” and “Comments”.
By default, the table consists of active viewers, their views descending (most views to 1). You can sort the table by all other entries by clicking on the respective table header.
The user’s avatar and name are linked to their profile page. When clicked, the profile opens in a new browser tab.
Scope of data
The report lists all users that generated at least one view, edit, comment etc. since the Viewtracker app was installed.
With a Content Synchronization, an administrator can include users that have been completely inactive since the Viewtracker installation.Users excluded from tracking can be excluded in this report using a filter (see below).
It can take up to 1 minute before a recent view is displayed in the report.
The entry “Protected Confluence Users” is in this report by default and is not clickable. It will only list views and other interactions if the Data Privacy is set to "Extended Privacy Mode".
Detailed User Interactions (Views, Creations, Edits, Comments)
You can find detailed information on the content a specific user has viewed, created, edited or commented on. To access that data, tap on the three dots next to one of the columns Views, Creations, Edits, or Comments.

An overlay will appear, displaying
the individual pages this user has viewed, created, edited or commented on (the metric depends on where in the table you had clicked)
the space in which the page is located.
the date and time of this interaction.

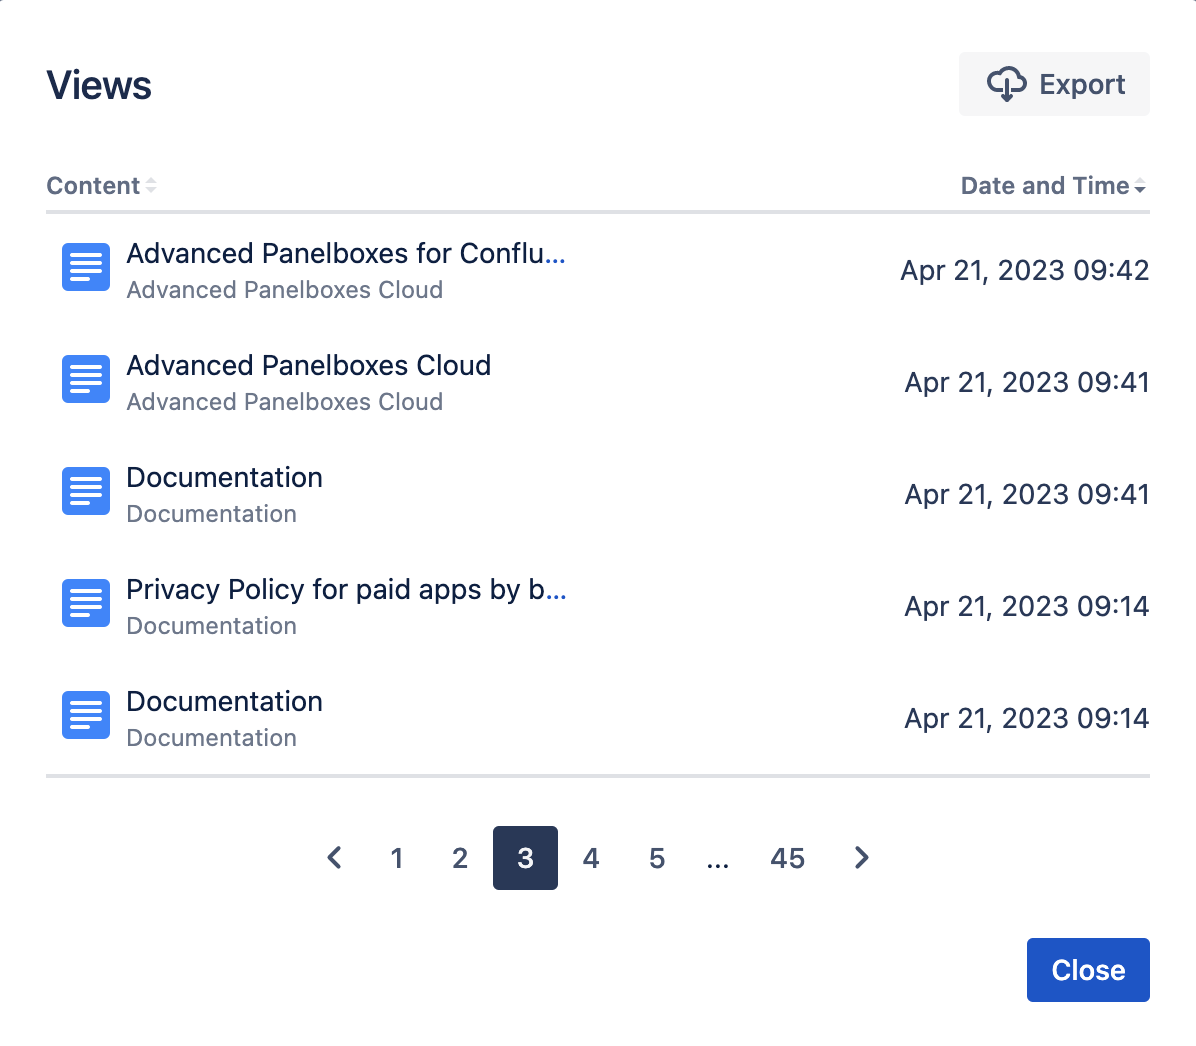
Page views of an individual user, sorted by date
Notes:
Tapping any content title will open the Content Report of that page or blog post in a new overlay.
The list is sorted by Date and Time by default. Tap the “Content” heading to sort the list by content title.
The list of the individual interactions can be exported (see section “Export data” below).
Summary
There is a summary below the table, consisting of the following data:
Number of users: Total of all user accounts on the instance.
Views: Total views that all the listed users generated
New Content: Number of all newly created pages and blog posts by the users listed
Edits: Number of edits that were generated by all the users listed
Comments: Number of comments generated by all the users listed
Filters
You can filter the report by
searching for a string in the search field (applies to usernames)
selecting one of the powerful filters. These will be explained in detail below. Remember that any filters you select apply to the selected date range.
Filter options in the Content & Usage Report: Users
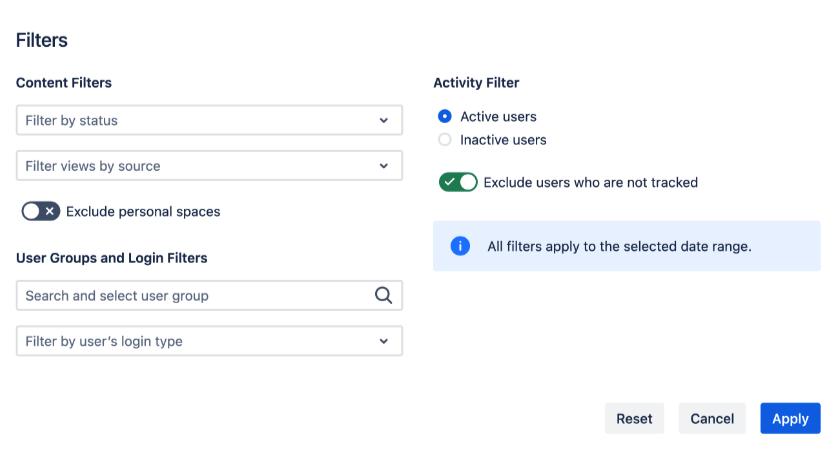
Content Filters
Filter by status: Select “Current” or “Archived”
Filter views by source: Select “Confluence” or “Scroll Viewport”.
Toggle: “Exclude personal spaces” (inactive by default)
User Groups and Login Filters
Type in and select a specific user group.
Note: This filter only applies to the user's current membership in a group.If a user moves from group A to group B, all historical views of the user will also move to group B.
An accurate historical analysis of usage by user groups is not possible, as users can leave groups and thus, the usage figures change accordingly.Filter by user’s login type: Select “Logged in Users” or “Anonymous Users”
Activity Filter
Radio button: Either select “Active users” or “Inactive users”
Toggle: “Exclude users who are not tracked” (active by default)
📖 Read possible use cases for this report in our blog post on bitvoodoo.app.
Export data
You can export the numbers of the report as a CSV file.
All numbers in the export refer to the selected filter and date range (last 30 days by default).
Export the main table
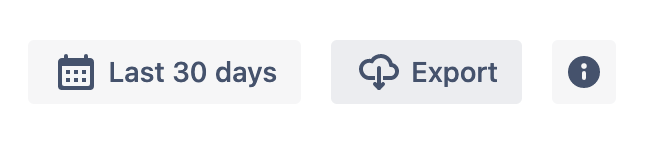
Tap the “Export” button next to the date range.
Confirm the amount of data.
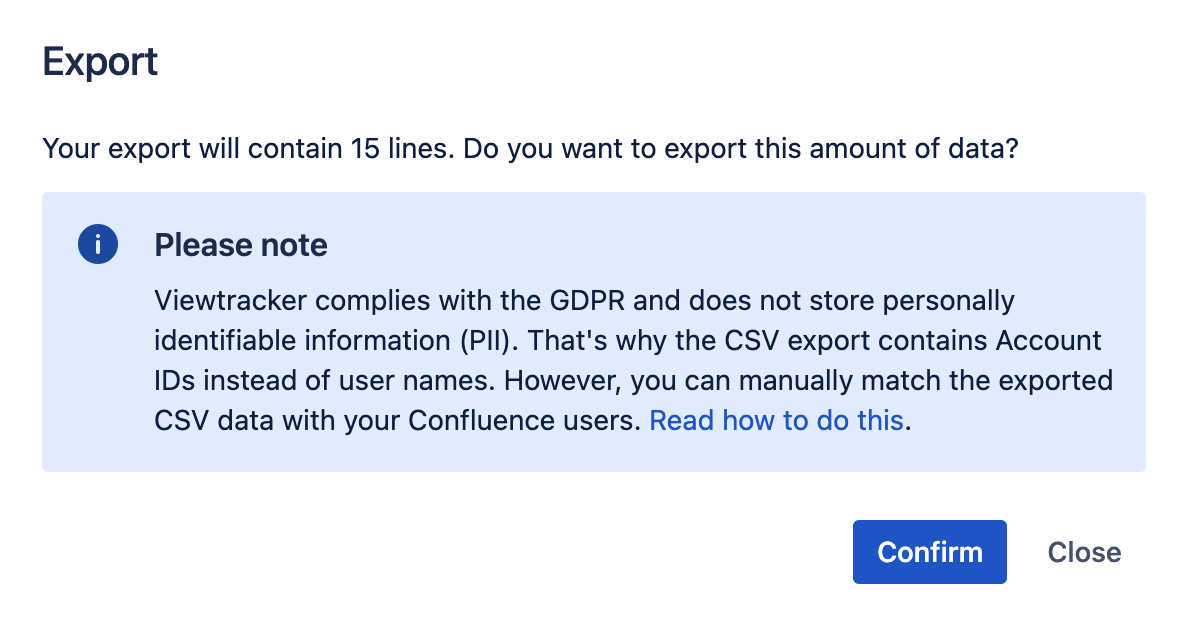
The CSV contains the aggregated data from the report, including the following:
"Account Id", "Views", "Creates", "Edits", "Comments"
If you need the username instead of the Account Id, please consult our FAQ: How do I find the username in the exported data?
Export the detailed user interactions (views, creations, edits, comments)
Tap the three dots in the “Views”, “Creations”, “Edits” or “Comments” column next to a specific user.

In the overlay, tap the “Export” button.
Confirm the amount of data.
The CSV contains the individual views, creations, edits or comments and consists of "Content Title", “Space Key” and "Date and Time".