Content & Usage Report: Content
List all content in your Confluence instance and how much it is used in a specified date range. Carry out quick actions, like deleting a page, directly in the report.
Content & Usage Report for content, as part of the Global Report
Accessing the Content & Usage Report: Content
This report can be accessed at the Global and Space levels.
How to access it from the Global Report?
There are two ways to access this report:
Click the “⚙” icon in the top right corner → select Analytics Cockpit (visible only to Confluence Administrators).
Navigate to the Confluence header → select Analytics Cockpit (visible to Admins and users with granted access).
Once inside, choose Content & Usage from the left-hand menu below the default Overview tab. The Content tab will be pre-selected.
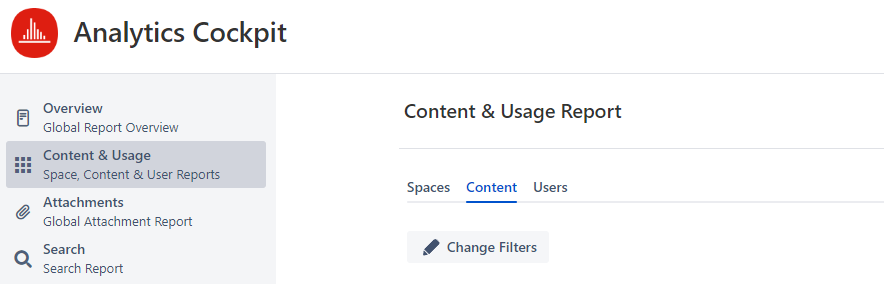
Screenshot demonstrating access to the Content & Usage Report: Content on a Gobal level
How to access it from the Space Report?
Navigate to your desired space.
Access the “Space Tools” section→ select Analytics Cockpit.
Choose the tab “Content.”
Screenshot of Content & Usage Report: Content with access from Space Report
Content & Usage Report: Content
Scope of data
Whenever the word “content” is used, it refers to pages and blog posts.
Attachments are not part of the Content & Usage Report.
This report does not list pages and blog posts in spaces excluded from tracking.
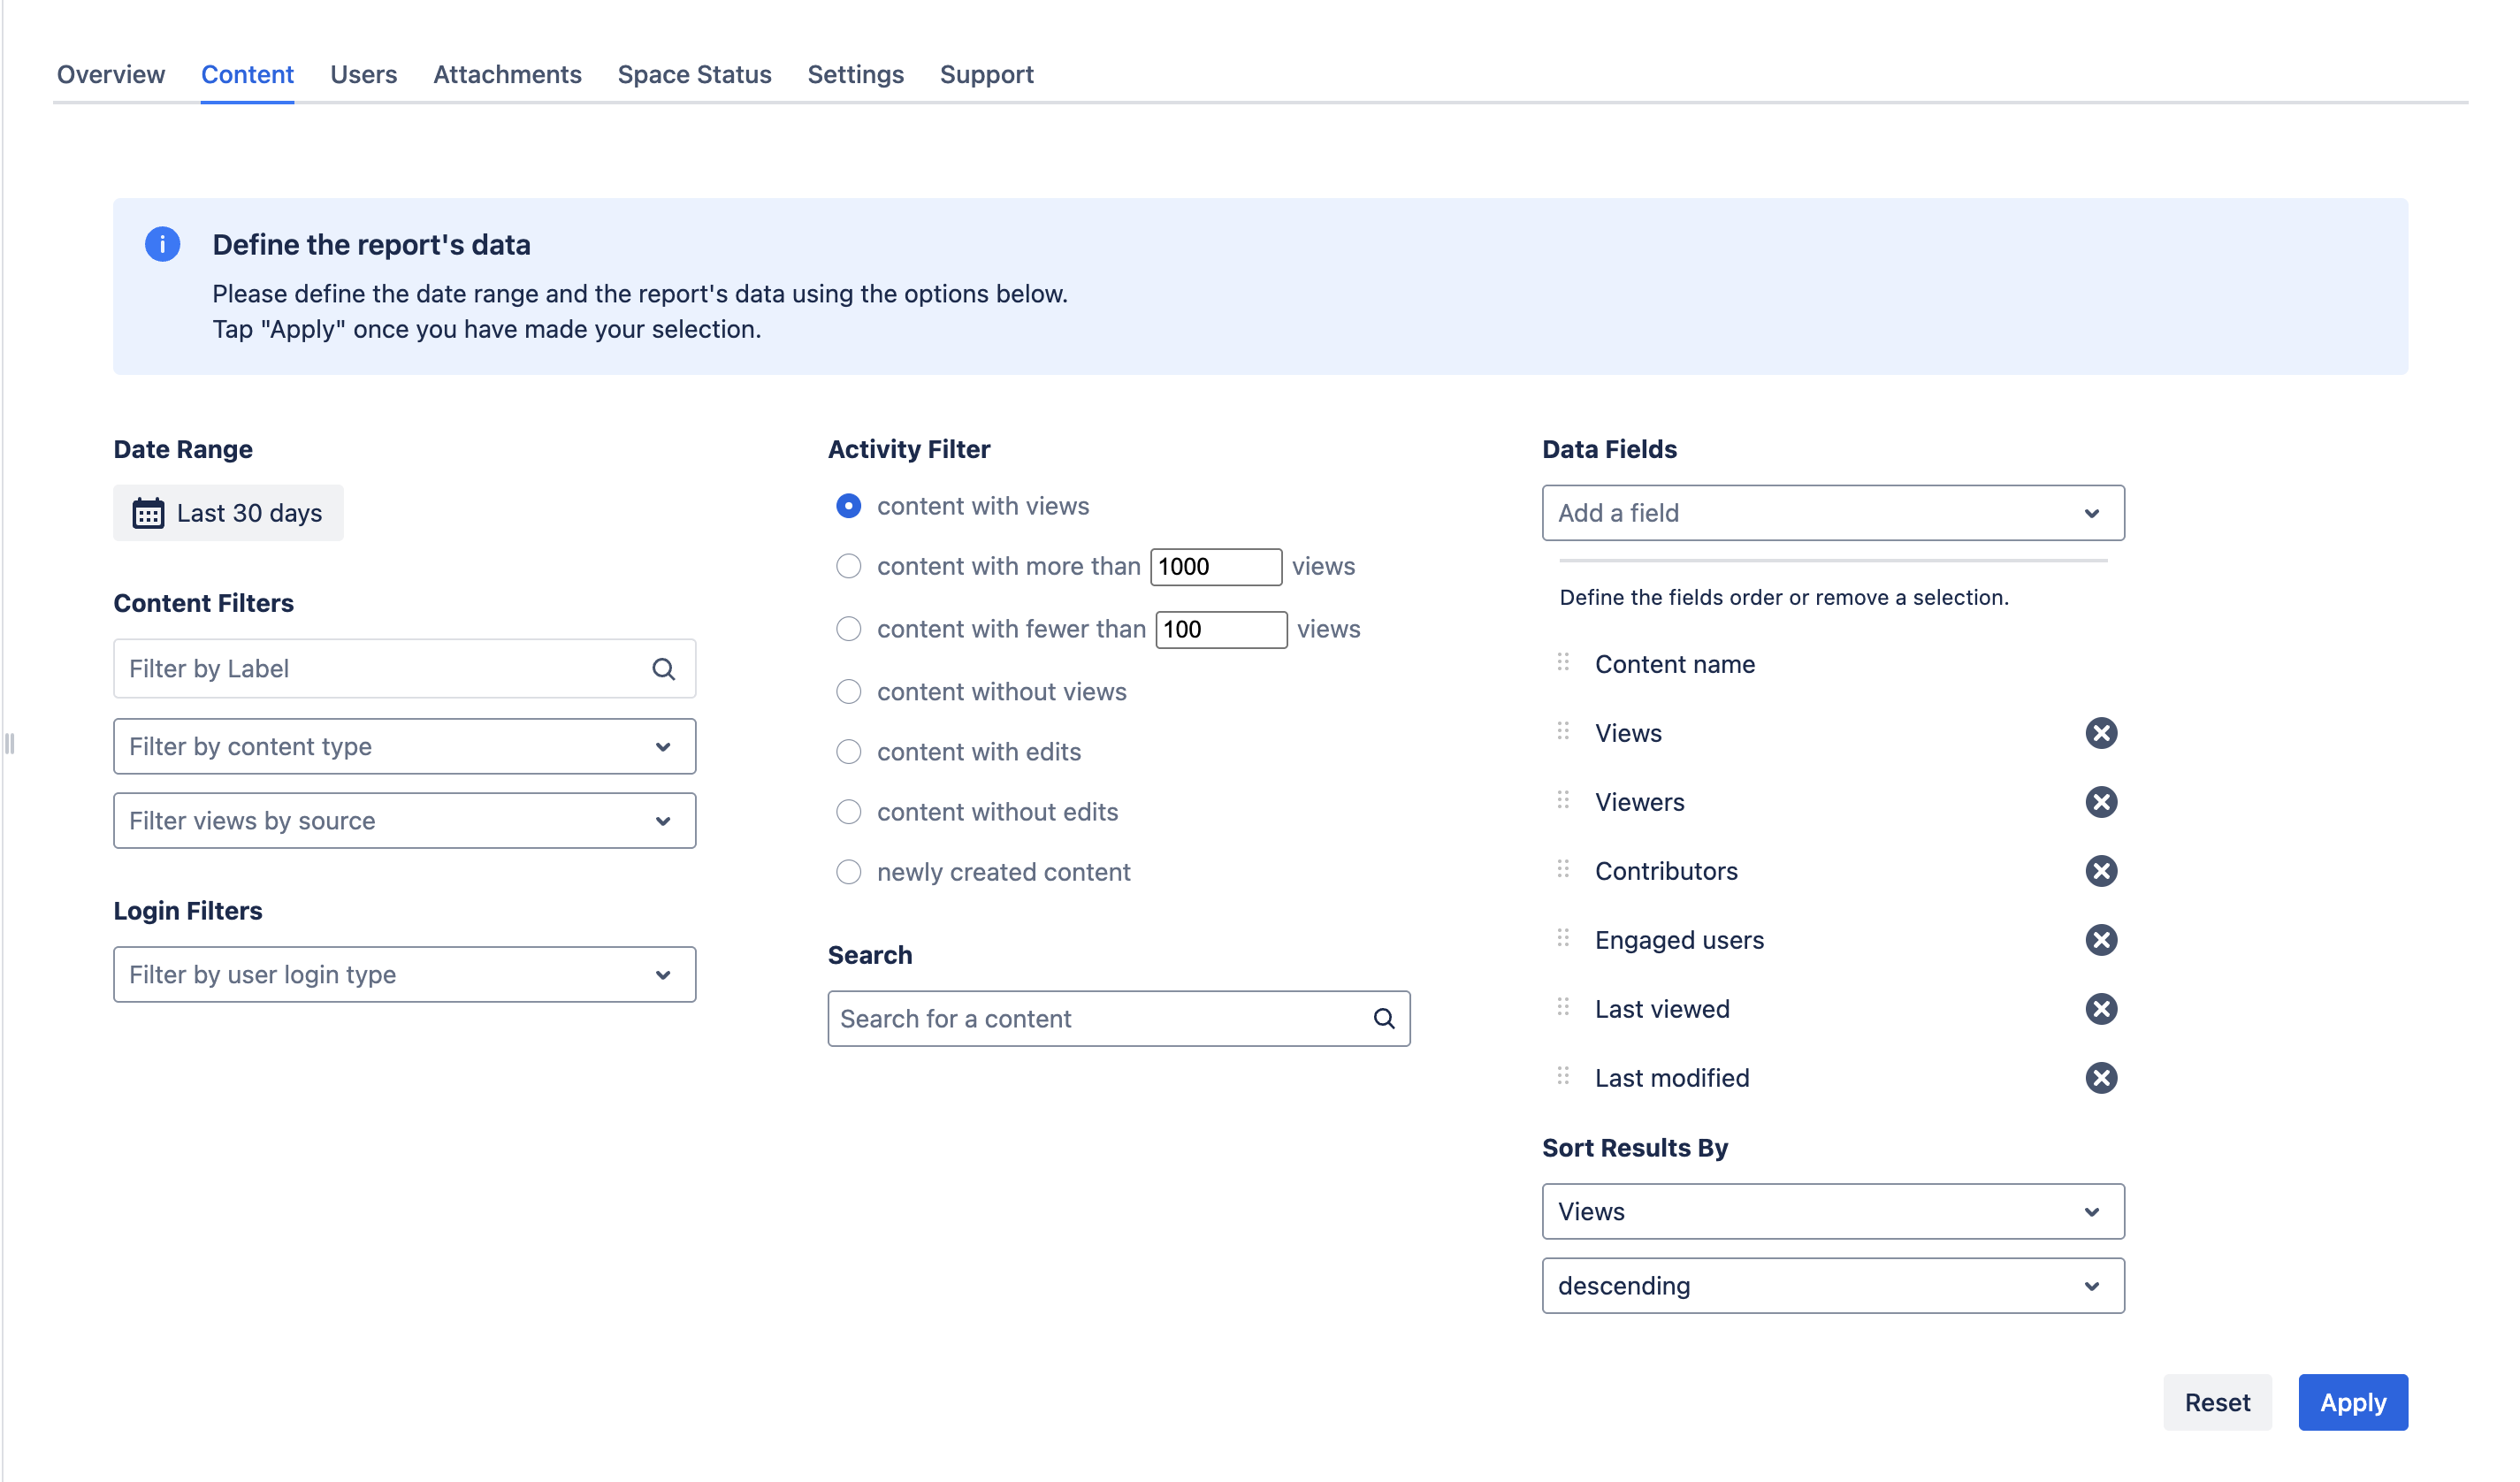
Report Creation Form
When accessing the Content & Usage Report: Content, the following form will load. Here, you can define the date range, specify data fields, and apply filters and sorting.
Currently, the following settings are available:
Date Range
Define the required date range of the report.
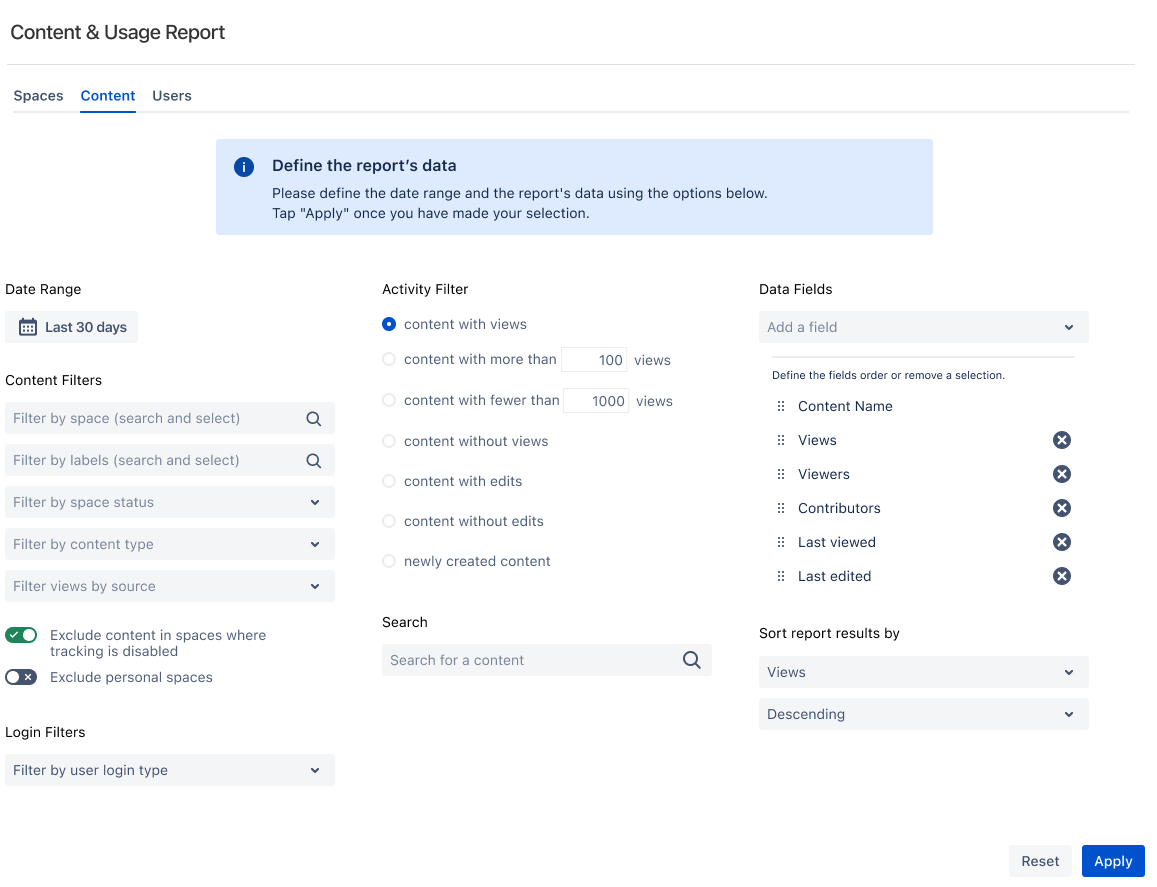
Content Filters
Filter by space: Type and select one or various spaces.
Filter by label: Search and select one or multiple labels.
Filter by space status: Select spaces that are currently active or archived. Only available in the Global Report.
Filter by content type: Select content type “pages” or “blog posts.” By default, pages and blog posts are listed in the report. Use this filter to drill down into the various content types.
Filter by source: Select to filter for views originating from these sources: Desktop, Mobile, Confluence Mobile, Jira Service Management, Linchpin App and Scroll Viewport.
Checkbox to exclude personal spaces and their content
Checkbox to exclude content in spaces where tracking is disabled.
Login Filters
Filter by user’s login type: Select “Logged-in Users” or “Anonymous Users”.
Sorting
Define by which data and in which order the report should be sorted.
Activity Filter
Content with views: Only display content with views within the selected date range.
Content with more than 1000 views: Type in any other number of views to see popular content.
Content with fewer than 100 views: Type in any other number of views to see content with few views.
Content without views: Only display content without any views within the selected date range.
Content with edits: Only display content that has been edited within the selected date range.
Content without edits: Only display content not edited within the selected date range.
Newly created content: Only display content that was created within the selected date range.
Search
If you want the report to consist only of content with a certain word in the title, insert the search term here.
The Data Fields option is only available for Confluence 9 users.
Data Fields
It is possible to extend and reduce the data fields displayed in the Content and Usage Report.
Tap “add a field” to select an option or tap on the remove icon to remove it.
By default, the following fields are presented: Content Name, Views, Viewers, Contributors, Engaged Users, Last viewed, Last edited.
You can change the order of the fields by using the drag-and-drop icon to adjust the position.
The content name can not be removed.
The following options are available:
Filter Name | Specification |
|---|---|
Attachment views | Views in the defined date range on all pages’ attachments combined. |
Average time spent | Average time spent in the defined date range for the listed content. |
Comments | Number of comments in the defined date range (page and inline comments). |
Contributors | Who contributed to the content in the specified date range? |
Creator | Who created the page? |
Edits | Number of page edits in the defined date range. |
Engaged users | Users who have engaged with the listed content. |
Last editor | The user who last modified and published the content, regardless of the set date range. |
Last modified | When was the content last edited, regardless of the specified date range? |
Last viewed | When was the content last viewed, regardless of the set date range? |
Likes (on comment) | Number of likes on comments within the defined date range. |
Likes (on content) | Number of likes for the content within the defined date range. |
Number of attachments | Total number of attachments on the page currently (independent of the date range) |
Page ID | The page’s ID |
Page versions | The latest page version number (independent of the date range). |
Publishing Date | The page’s first publishing date. |
Restriction | Yes, if the page has any access restriction defined. No, if no restriction is defined. |
Viewers | Number of people who have viewed the content in the defined data range. |
Views | The total number of views for the content within the defined date range. |
Watches | Number of new watches activated for the content in the defined date range. |
Tap the “Apply” button once you have made your selection. Viewtracker will now generate the desired Content & Usage: Content report.
📖 Read possible use cases for this report in our blog post on bitvoodoo.app.
Report generation
The report data will be collected in the background, and a loading screen will appear. If you prefer not to wait, you can navigate away from this page and return later.
The report will be displayed once Viewtracker has gathered and sorted the data.
Loading times may vary depending on the date range selected and the volume of data in your Confluence instance.
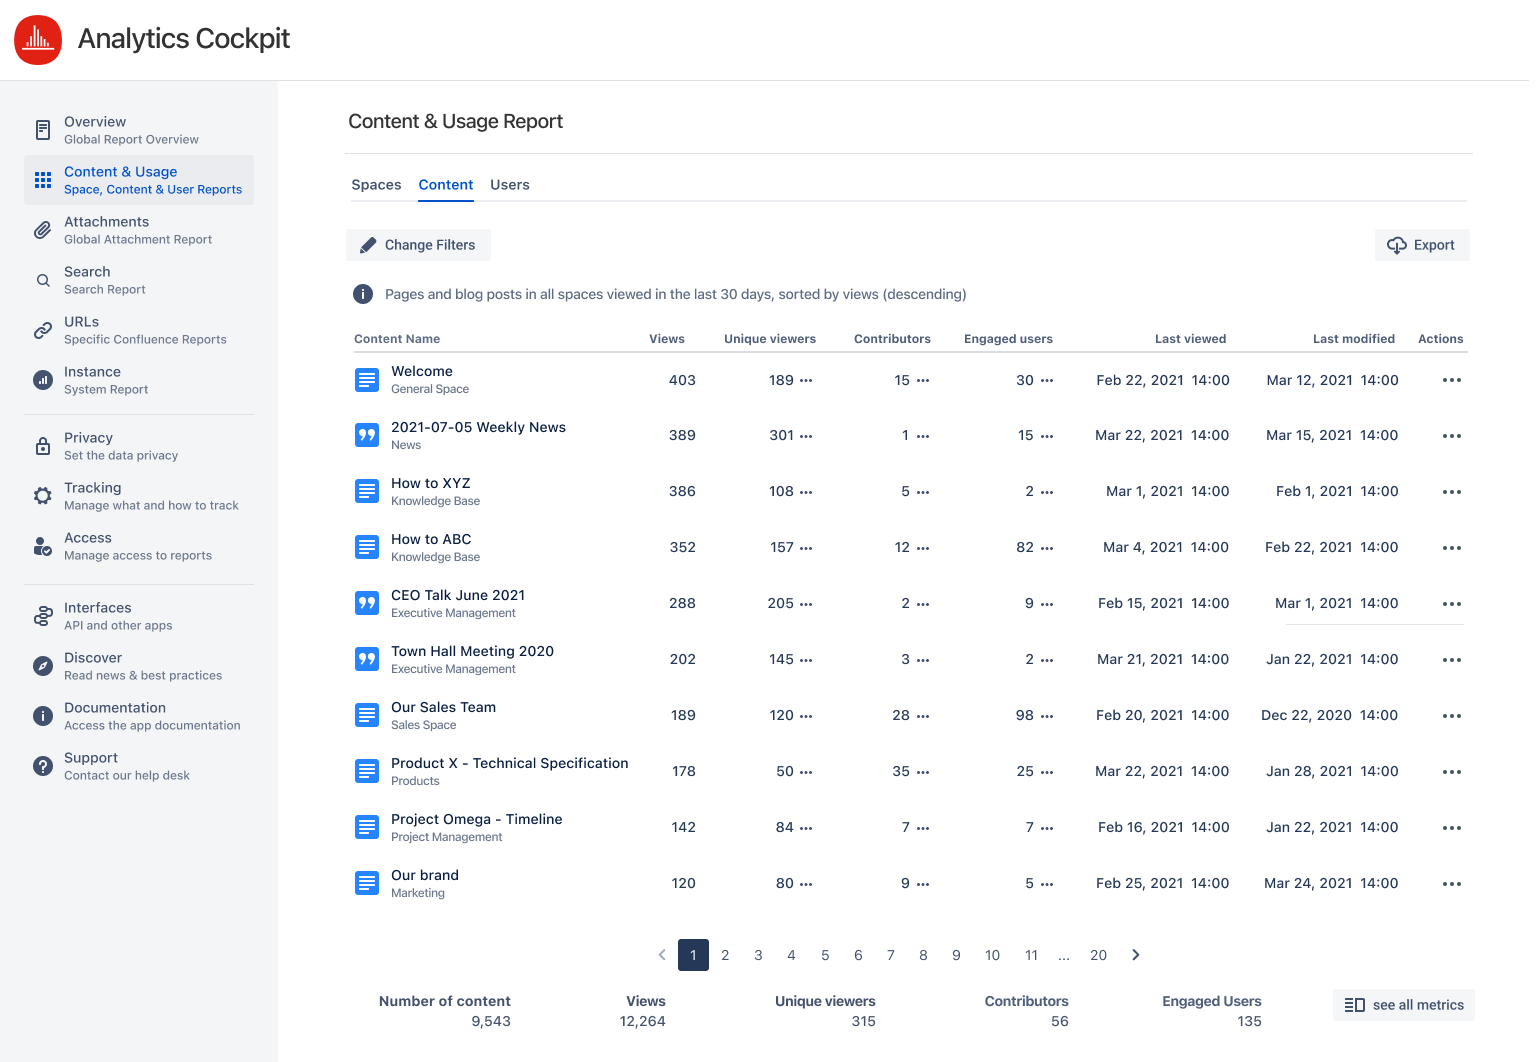
Content & Usage Report for content, as part of the Global Report
Tap the “Change Filters” button to define a new date range, set other filters, or change the sort order. You will be directed back to the report creation form.
Hint for Frequent Use of the Content & Usage Report
Please note that there is a limit to how many reports can be created at once. This is to prevent performance issues, especially for Confluence instances with extensive tracked data.
If you receive a message indicating the maximum number of reports has been reached, simply try again later.
Total bar
There is a total bar below the table that consists of the following data:
Number of content: The number of content units (pages and blog posts) in the selected filter
Views: All views of all active content accumulated within the selected date range
Viewers: All Viewers who have accessed the content within the selected date range
Contributors: The number of Confluence users who have contributed to the content within the selected date range
Engaged users: The number of Confluence users who have commented, liked or watched a piece of content within the selected date range

All metrics summary
There are more metrics than those mentioned above. Tap the button “See all metrics” in the down-right corner of the table. A window will pop up, giving you more details.
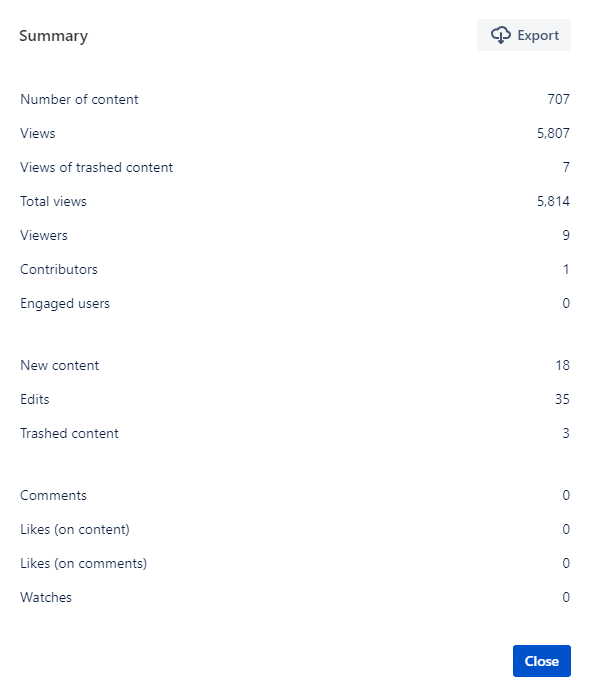
All numbers refer to the selected filter (see above) and date range (last 30 days by default).
The numbers in this summary include the following:
Number of content: The number of content units (pages and blog posts) in the selected filter
Views: All views of all active content accumulated within the selected date range. Views of trashed content are not included in this total.
Views of trashed content: Views of content that is currently located in the trash.
Total Views: Views of all active content accumulated within the selected date range. Views of trashed content are also included.
Viewers: All Viewers who have accessed the content within the selected date range
Contributors: The number of Confluence users who have contributed to the content within the selected date range
Engaged users: The number of Confluence users who have commented, liked, or watched a piece of content within the selected date range
New content: Content created within the selected date range
Edits: The number of page and blog post edits within the selected date range
Trashed content: The number of content moved to the trash bin within the selected date range.
Archived content is not included in the “Trashed content”. The report does not track if a space is archived or if pages are moved to an archived space. If users access the content of an archived space, the report will track the view.
Comments: The number of comments within the selected date range
Likes (on content): The number of likes of pages or blog posts within the selected date range
Likes (on comments): The number of likes of comments within the selected date range
Watches: The number of times a piece of content was added to the watch list of a user within the selected date range
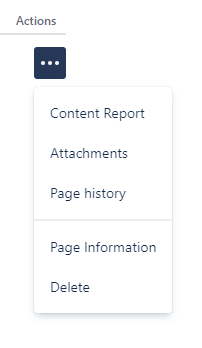
Content Actions
Since fall 2023, you can carry out quick actions directly in the overview table. For example, you can delete a content piece that was not viewed for an extended period.
Tap the three dots in the “Actions” column to:
Access the Content Report of this content
Access the attachments
Access the page history
Access the page information
Delete this content
Some of these actions will open a new tab. Depending on your permissions, you may not be allowed to carry out these actions.
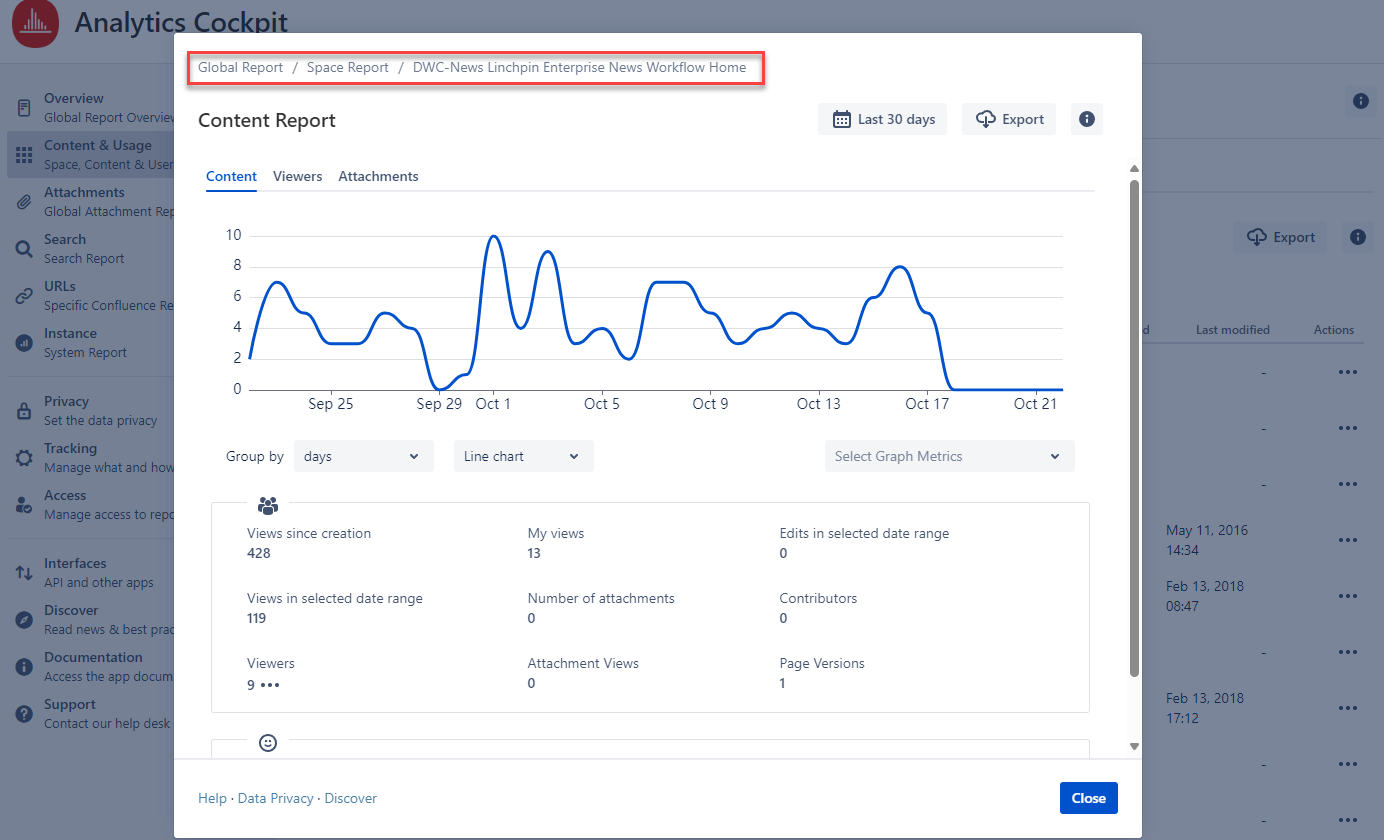
Navigating to other reports
You can access additional Viewtracker reports within the Content & Usage Report.
To do so, click on any page name in the “Content Name” column. This action will open an overlay displaying the Content Report for that specific page.
Breadcrumbs will guide you to either the Space Report (where the page resides) or the Global Report.
The entry on the right side of the breadcrumb shows the page or blog post name. Clicking the name will open the page in a new tab, allowing you to view its content directly.
![]() The date range and metric grouping selected in one report will automatically be adapted to the other reports.
The date range and metric grouping selected in one report will automatically be adapted to the other reports.
Saving and sharing reports
Once you’ve applied a filter or changed the report's date range, the report’s URL will adapt with parameters like:
?dateValue=this.week&contentType=blog.This is useful for the following reasons:
You can copy and share the URL with co-workers with the same access permission.
You can save the URL to access a customized report quickly.
Export data
All numbers in the export refer to the selected filter and date range (last 30 days by default).
You can export data from the Content Usage Report as a CSV file. Here’s how to export different items within this report:
Main table: Click the “Export” button next to the date range and confirm the amount of data.
All metrics summary: Click the “Export” button in the overlay.
Viewers: Click the “Export” button in the overlay.
Contributors: Click the “Export” button in the overlay.
Engaged users: Click the “Export” button in the overlay.
The CSV contains aggregated data from the report, including:
Main table: The CSV file contains the data fields you defined for the report in the report creation form.
All metrics summary: Number of content, Views, Views of trashed content, Total views, Viewers, Contributors, Engaged users, New content, Edits, Trashed content, Comments, Likes (on content), Likes (on comments), Watches.
Viewers: Viewer, Times Viewed, Last Viewed.
Contributors: Name, Times Contributed, Last Contributed.