📋 Content Report
.png?inst-v=e7a5baea-dbb0-4ac1-ab4a-0cf567f08382)
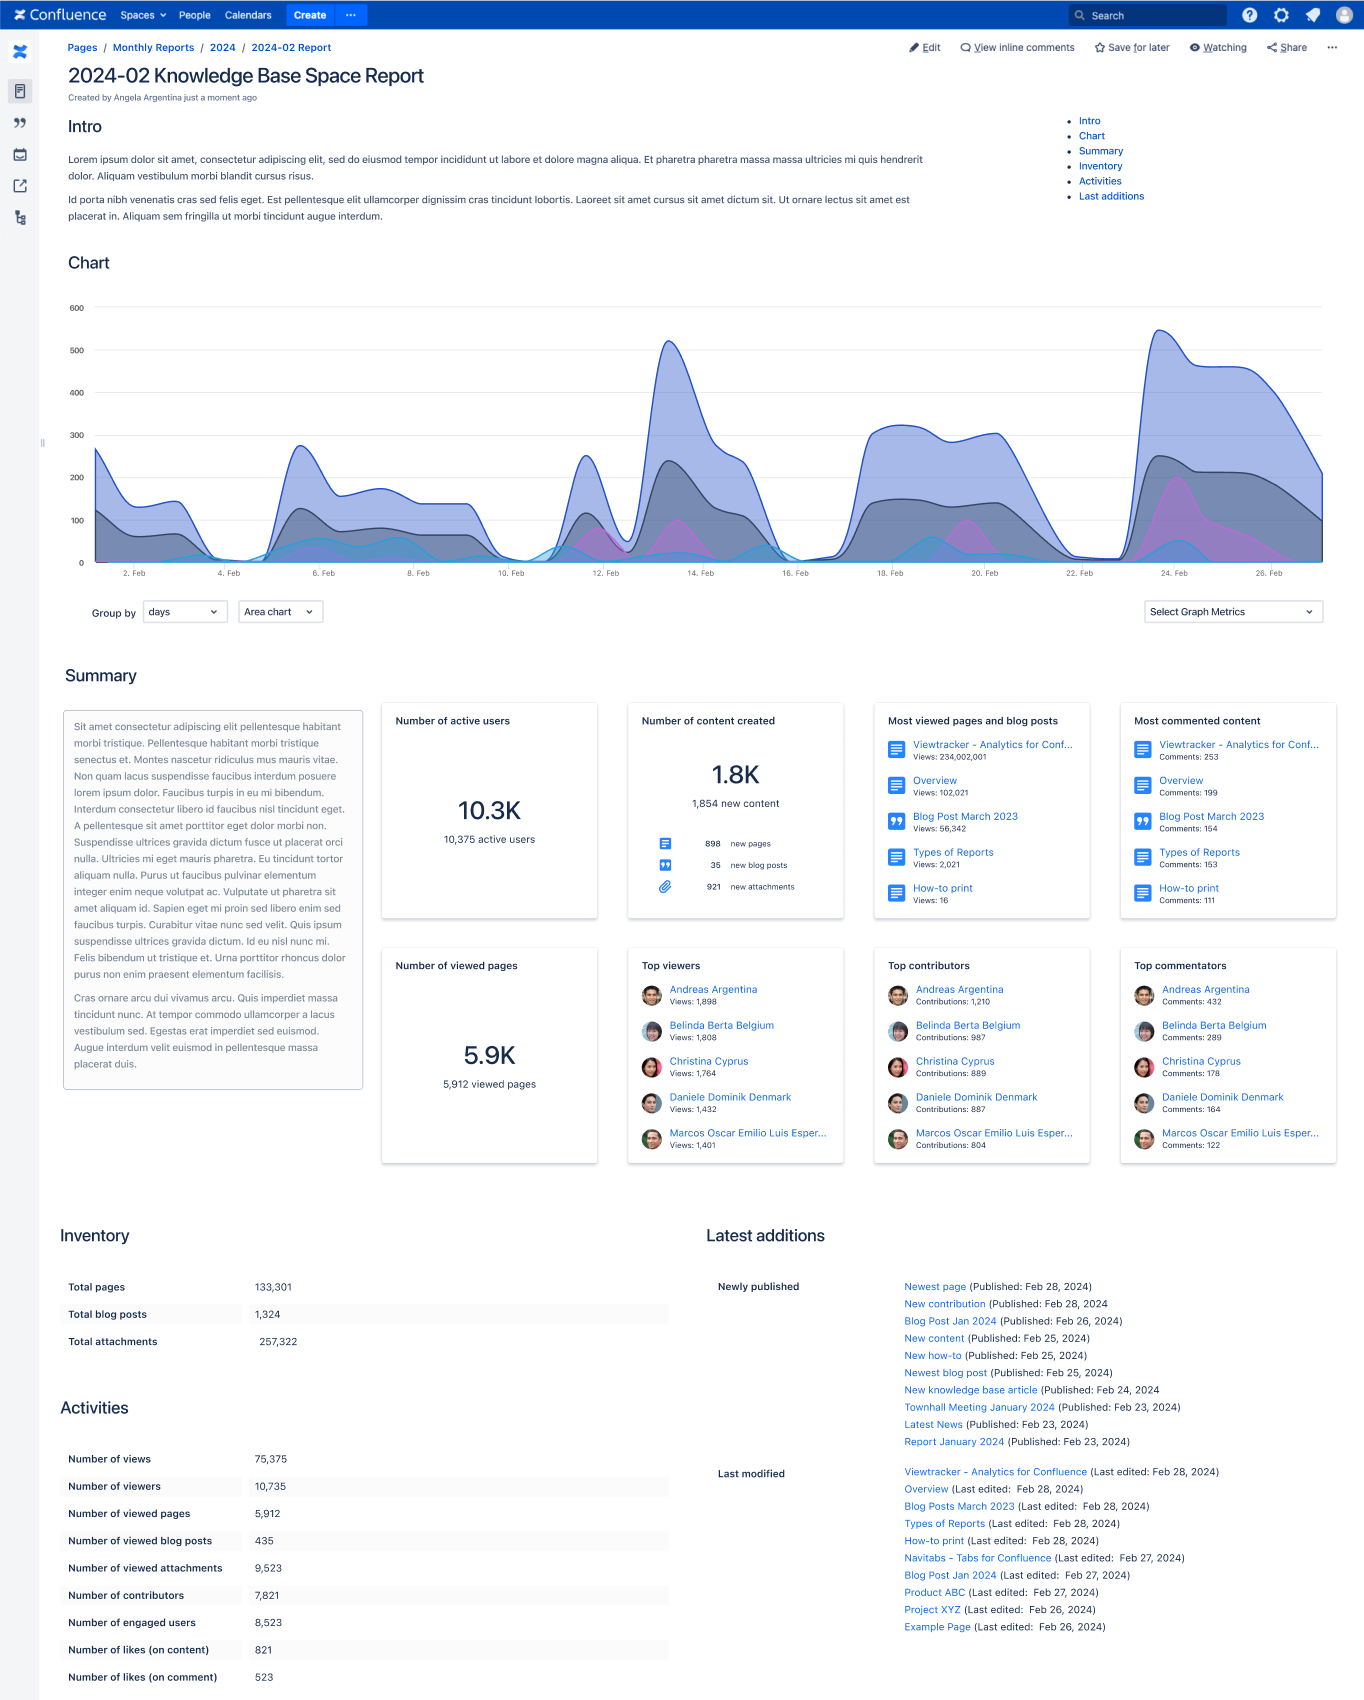
Screenshot of the Content Report
What can the Viewtracker Content Report do for you?
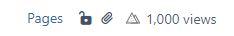
See the total number of views a page or blog post attracted in the page's header.
Analyze the average time users (logged-in Confluence users, anonymous visitors, and readers of the Jira Service Management knowledge base) spent viewing or interacting with this page. See Tracking Settings.
Select different date ranges and observe how the metrics and graph update accordingly.
Group the metrics in the graph by day (default), week, month, or year.
Display these metrics via Line (default), Bar or Area charts.
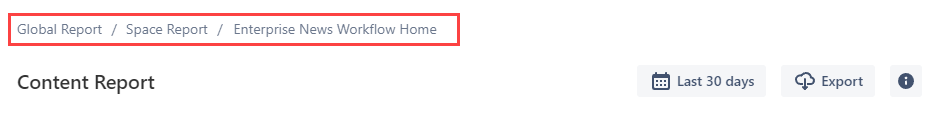
Use the breadcrumb in the header to switch between Content, Space and Global Report (depending on access permission).
In the "Viewers" tab, you can view who has viewed the page, the number of times they have viewed it, and the amount of time spent on it, depending on your privacy and time tracking settings.
In the tab “Attachments,” see the number of attachments and attachment views.
Export the page views, viewers list, content edits or attachments views.
So you spent precious time crafting an inspiring blog post or a helpful knowledge-base article. Wouldn't it be cool to see how many viewers your work attracted? Well, with Viewtracker, you can!
If Viewtracker is enabled globally (the default), you will see the number of views displayed on every page and every blog post. The information is displayed next to the page restrictions. This view counter can also be turned off in the app settings.

Screenshot highlighting Viewtracker’s View Counter
(For the sake of readability, we will write "page" instead of "page or blog post," but all options are the same with blog posts.)
Accessing the Content Report
Go to the Confluence page you want to analyze.
Access the Content Report for this via:
Clicking on the Viewtracker icon or the number of views.
Screenshot displaying the View Counter
Or, accessing it via the page menu:
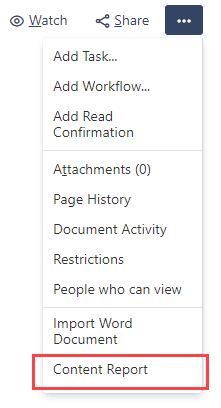
Screenshot displaying the Content Report item
The Content Report opens as an overlay. It is divided into three tabs: Content, Viewers, and Attachments.
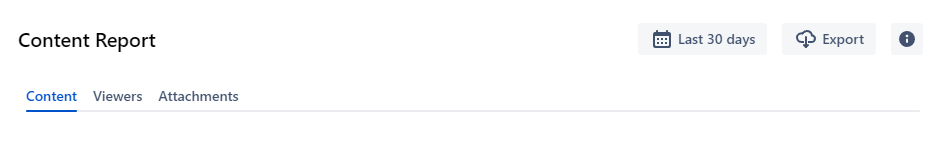
Screenshot: Tabs within the Content Report.
Tab "Content"
The "Content" tab is selected by default and contains a graph of this page's views and edits over the last 30 days, as well as a summary of its activity.

Elements of the Content Table
The table below the graph contains the following valuable metrics:
Views since creation: The number of views this page has had since it was created.
Viewers: every individual user who has visited this page. Clicking on the three dots will open the tab “Viewers” (see below).
Views in selected date range: The number of this page's views in the selected date range.
The numbers of "Views since creation" and "Views in selected date range" will be the same if the page was created only recently.
Attachment views: How many times were the attachments viewed or downloaded? Clicking on the three dots will open the tab “Attachments” (see below).
My views: The number of times you have viewed this page yourself.
Avg. time spent: the average time a user (logged-in Confluence users, anonymous visitors, and readers of the Jira Service Management knowledge base) spent viewing or interacting with Pages & Blog posts across the instance.
Contributors: How many Confluence users have contributed to the page content?
Page versions: The number of times a new version of this page was published.
Edits in selected date range: How many times was the page edited?
Attachments: How many files are attached to this page?
Engaged Users
The report also includes a section on social engagement.
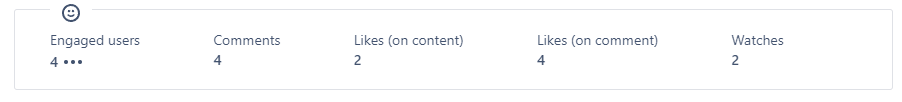
Screenshot: Table containing social engagement metrics.
Engaged users: users who have commented, liked, or watched a page or blog post. With the standard privacy setting, you can see their full names and the date and time of their last visit by clicking the three dots.
Tab "Viewers"
If the "Viewers" tab doesn't appear, it may mean that the Confluence administrator has set a higher level of Data Privacy.
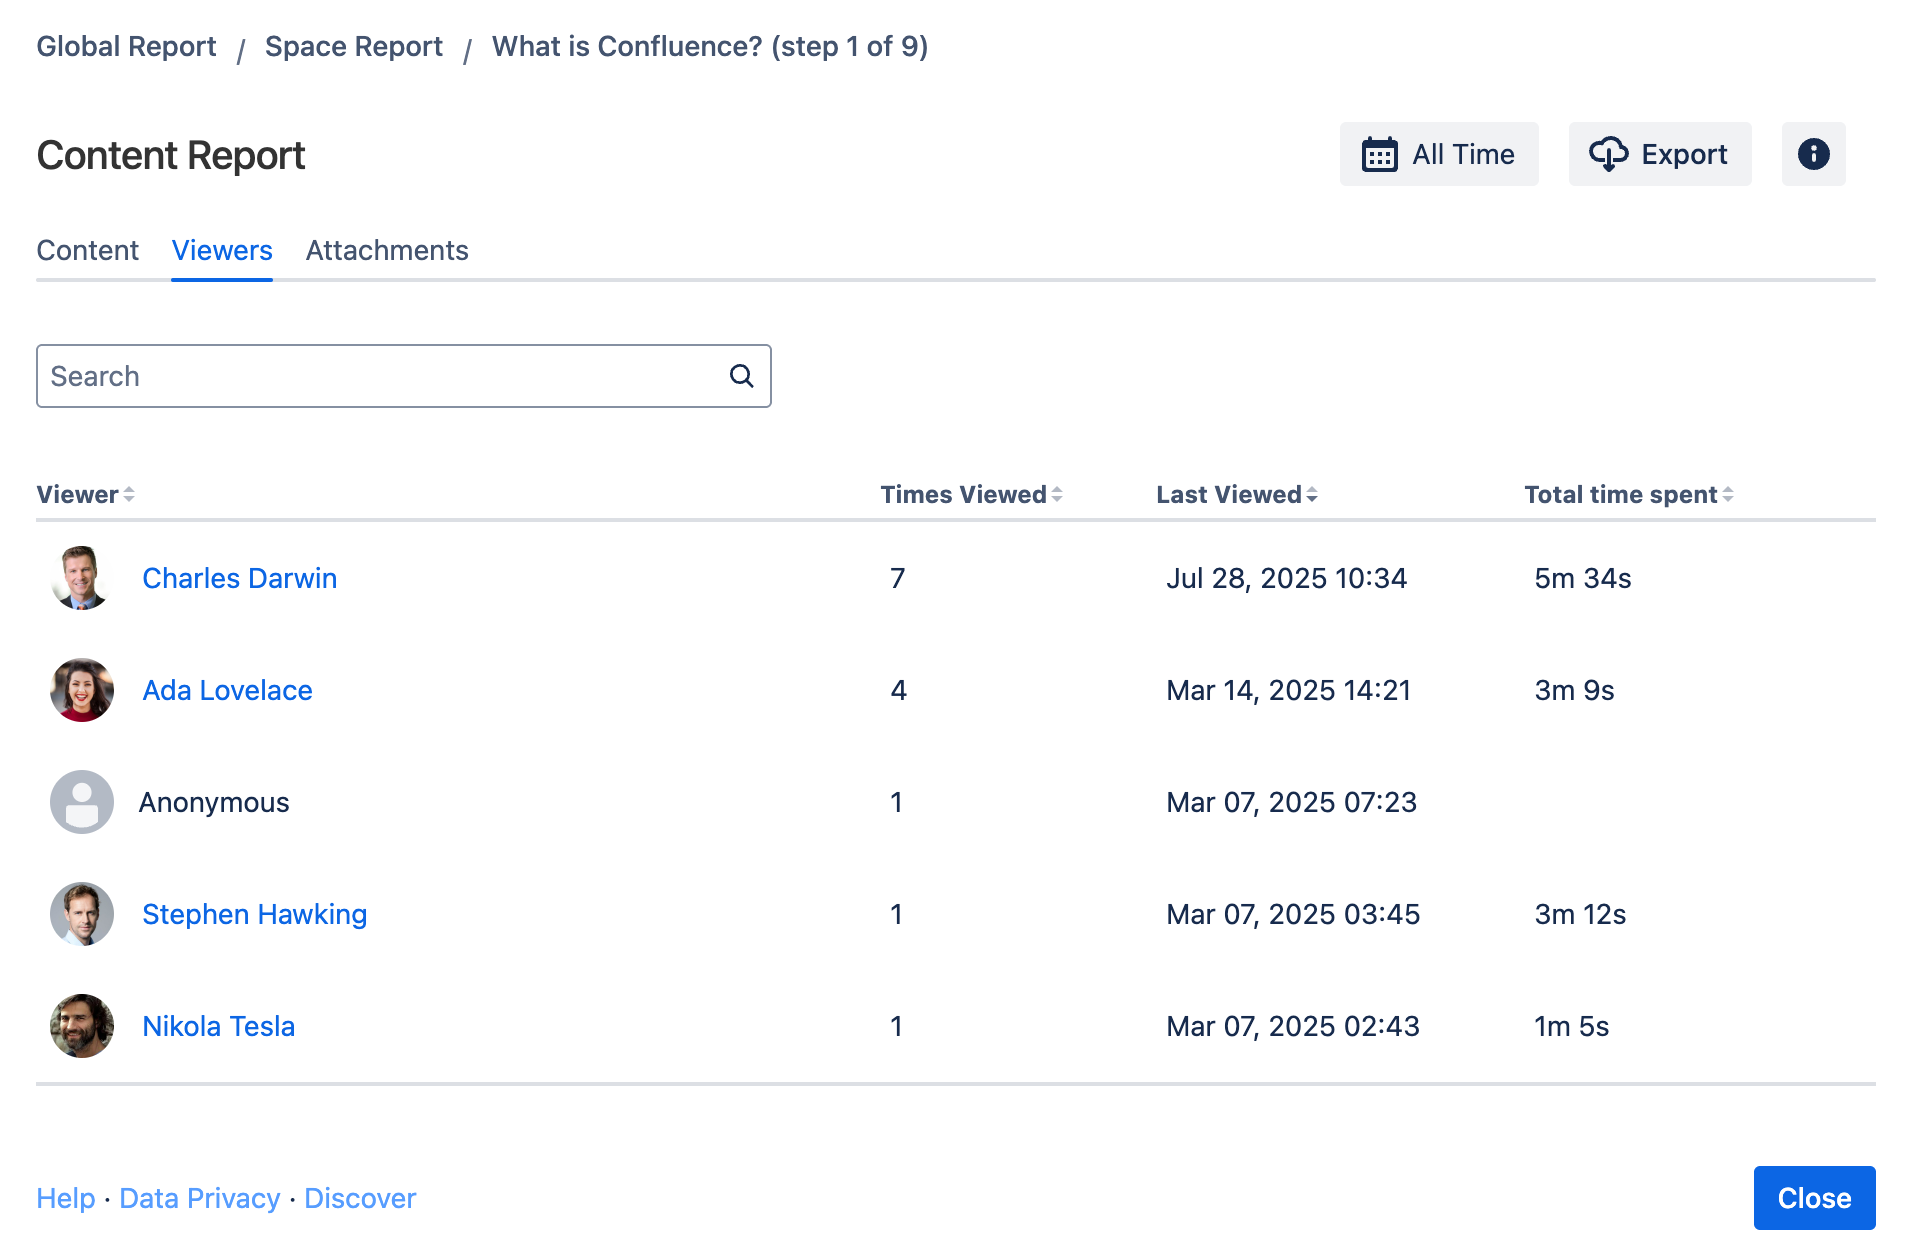
The "Viewers" tab displays a table of all users who viewed your page within the selected date range, along with the total time spent by each user.
The table is sorted by “Last viewed” and displays the last time the user has viewed this page.
If time tracking is enabled, the metric “Total time spent“ by the logged-in user on this page is listed.
Through the search field, you can filter the list by name.
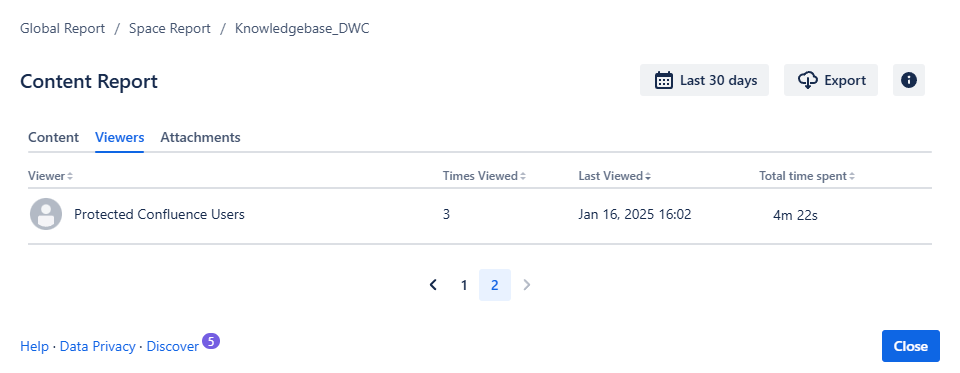
Special Viewers
If you see "Protected Confluence Users" in the tab "Viewers," this can mean the privacy settings were once set to “Anonymize Viewers” or “Extended Privacy Mode.”
If your page or blog post is open to the public, you may also see the number of anonymous users (external visitors without a Confluence log-in).
Tab “Attachments”
This report displays the attachments on the page you are currently viewing. The list depends on which types of attachments the Confluence administrator has chosen to track in the global attachment settings.
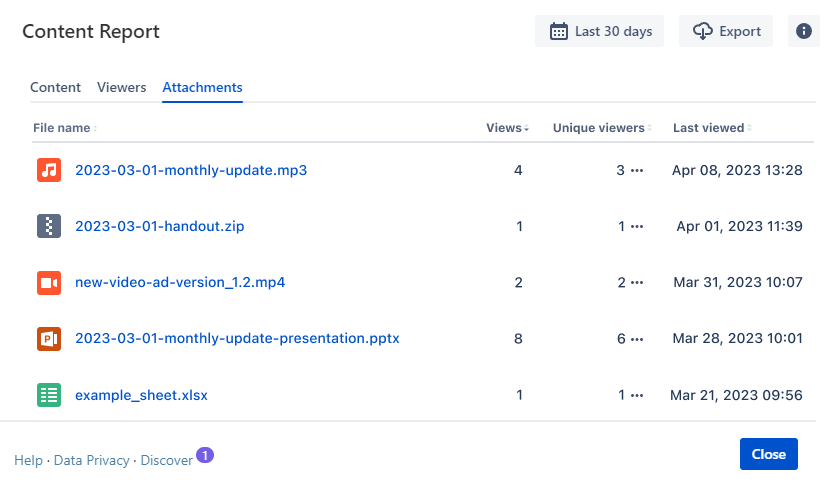
Screenshot: View of the Attachment tab.
The column “Views” lists the number of views this attachment has generated in the selected date range.
The column “Unique Viewers” lists the number of viewers who have viewed or downloaded the attachment.
The three dots next to that number are only displayed if the data privacy allows it. A click on the three dots opens the modal dialogue for viewers.
The “Last viewed” column displays the timestamp of the last time an attachment was viewed or downloaded.
Changing the date range and graph type
By default, data from the last 30 days is displayed. You can change that by clicking into the date field and selecting a different date range. All metrics will adapt automatically.
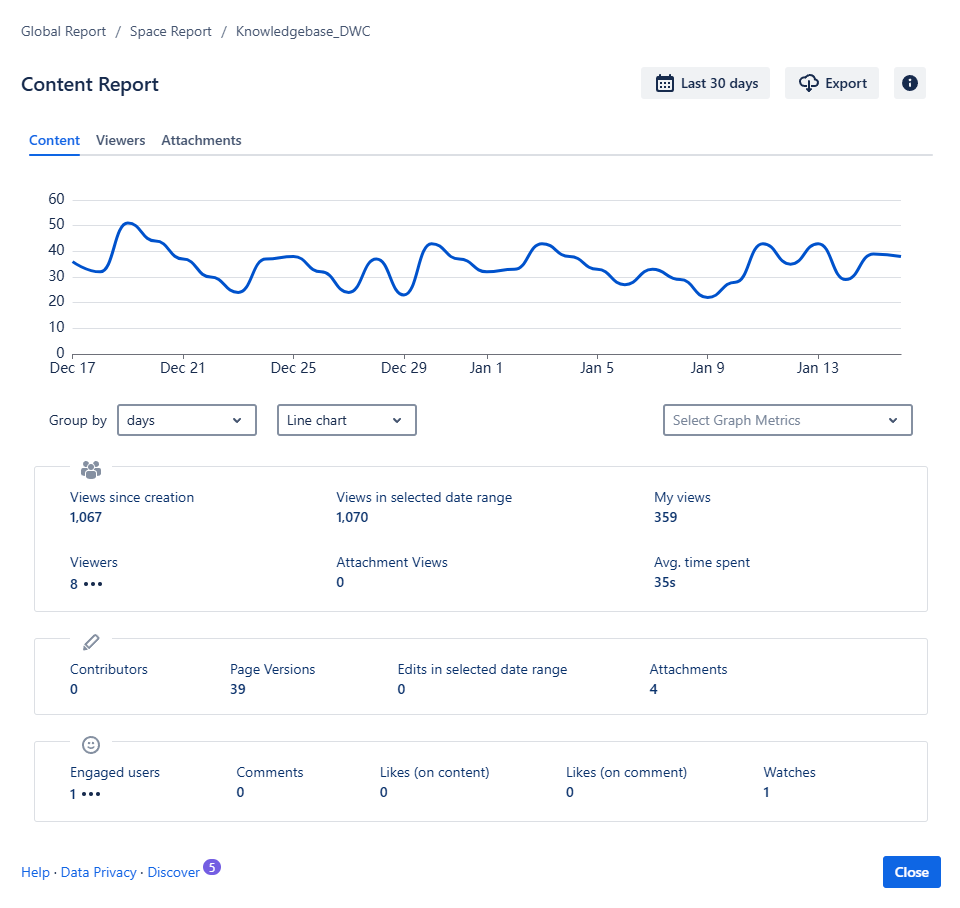
You can group the metrics in the graph by using the “Group by” option, which defaults to days, but also includes weeks, months, and years, as well as the chart type, which includes Line (default), Bar, and Area charts.
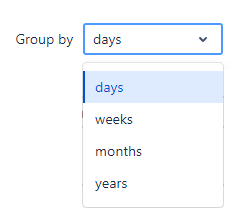
Time filters available.
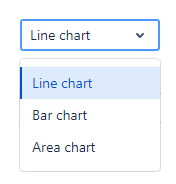
Available chart types.
Choosing which metrics to display in the graph
Below the graph, a drop-down menu lists the available metrics. By default, “Views,” “Versions,” and “Edits” are selected.
Select the metrics you want to appear in the graph, and the graph will adapt automatically. Viewtracker saves the metric selection; whenever you access the report in the future, the selected metrics will be displayed in the graph.
![]() Versions are marked by a red vertical line on a specific date. A page may have various versions published on the same date. Versions are displayed as a trend line.
Versions are marked by a red vertical line on a specific date. A page may have various versions published on the same date. Versions are displayed as a trend line.
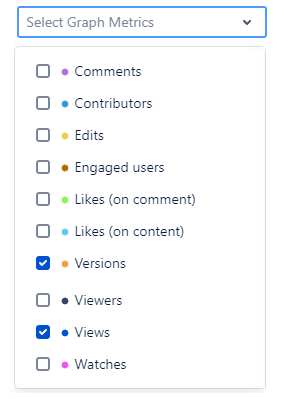
Metrics available for the Chart within the Content Report
Navigating to other reports
Use the breadcrumb in the header to access the Global Report or Space Report (depending on your access permission).
The Global or Space Report will open as a new tab. The date range and metric grouping selected in one report will be automatically applied to the other reports.
The entry on the right side is the page/blog post name. Tapping it will open the page in a new tab, allowing you to access its content.
Alternative to Content Report: Analytics Report Macro
You can display the statistics for a specific page using the Analytics Report Macro. The macro can be placed on any page, so you can create dashboards with all the pages that are of particular interest to you.
Screenshot: Example of a page with multiple Analytics Report macros
Exporting data
To export the Content Report, first access your desired page and click the Viewtracker icon (or access via the three dots “…“ and click Content Report).
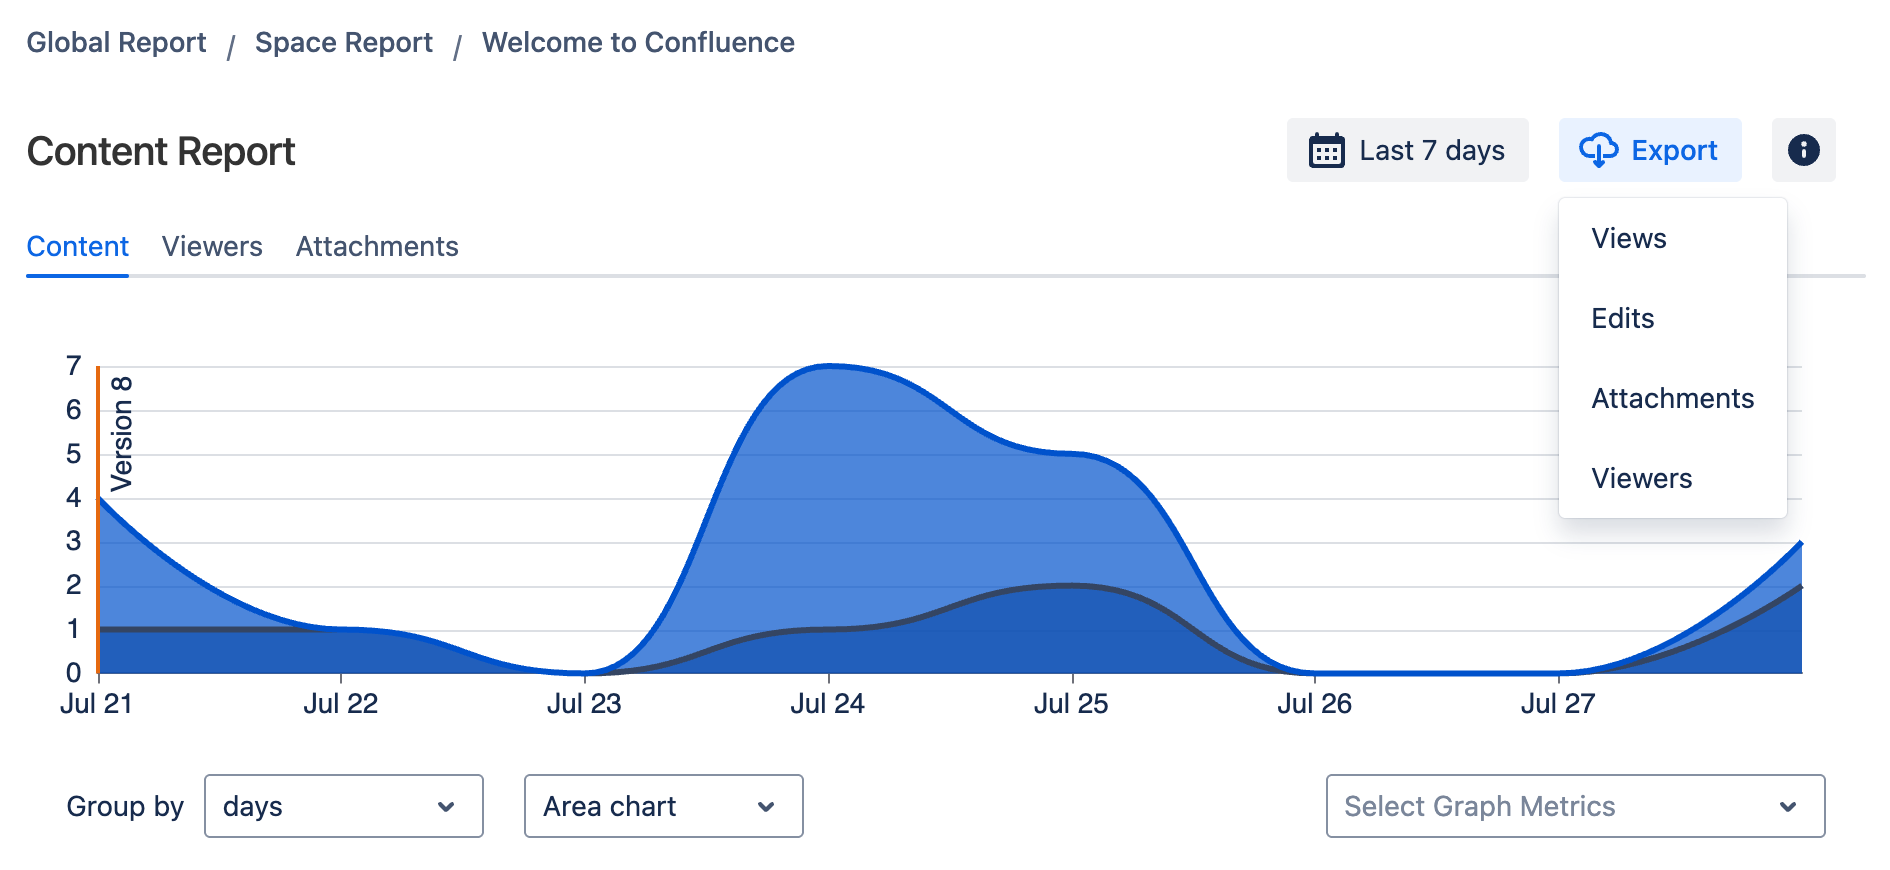
Export Options for Content Report
Exporting Views
This exported CSV file will contain the following categories:
Visit ID, Username, Full Name, Content ID, Content Title, Content Type, Source, Space Key, Space Name, Visit Date, UNIX Date
Exporting Edits
The edits CSV will contain:
ID, Username, Content Title, Content Type, Space Key, Space Name, Date, Unix Date
Exporting Attachments
The CSV will list the metrics surrounding attachments in these categories:
View ID, Attachment ID, Attachment Name, View Date, View UNIX Date, Full Name
Exporting Viewers
This CSV will export the aggregated content views as displayed in the Viewers Tab and contains:
User ID, Username, Fullname, Content Title, Content Type, Space Key, Space Name, Viewer’s Name, Times Viewed, Last Viewed, Last Viewed Unix Date, Total Time Spent (if time tracking is enabled)
![]() Please note that the categories' Full Name” and “Username” can display values as “Anonymous” if Extended Privacy Mode is enabled.
Please note that the categories' Full Name” and “Username” can display values as “Anonymous” if Extended Privacy Mode is enabled.