Space Status Report
This is a new Viewtracker report introduced in January 2024.
Discover how a specific space in Confluence Data Center is developing:
Select metrics (number of content/attachments, active users, etc.) and display their development in a chart.
See the week’s least and most active time slots for the selected space and date range.
See the top 10 content based on the metrics available in the drop-down menu.
Accessing the Space Status Report
You can access the Space Status Report by navigating to a specific space and choosing ⚙ Space Tools → Analytics Cockpit
Select the tab “Space Status”.
This will open the condensed version of the report, listing:
number of pages and blog posts on this space
number of attachments on this space
size of attachment storage.
Set a date range and tap “Apply” to load the full report.
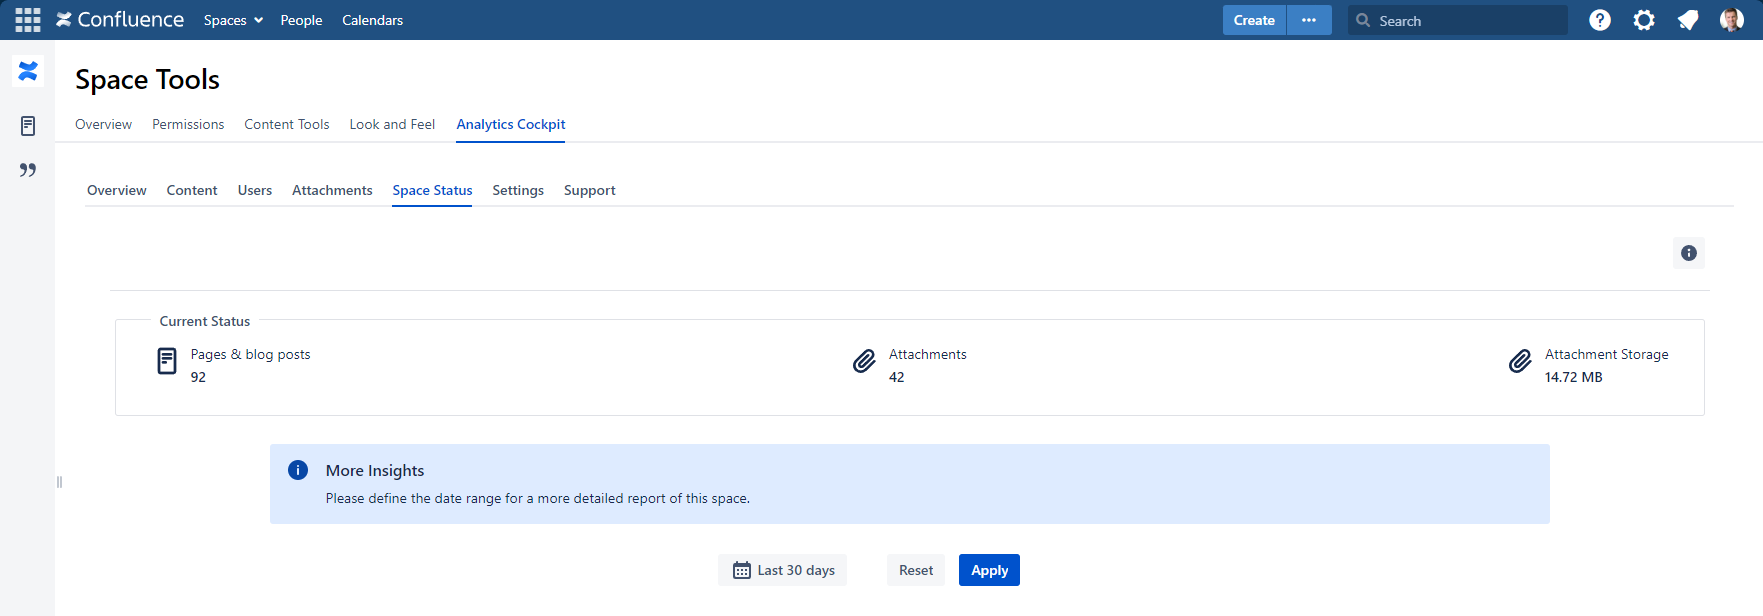
Screenshot of Space Status on its condensed version.
Full Space Status Report
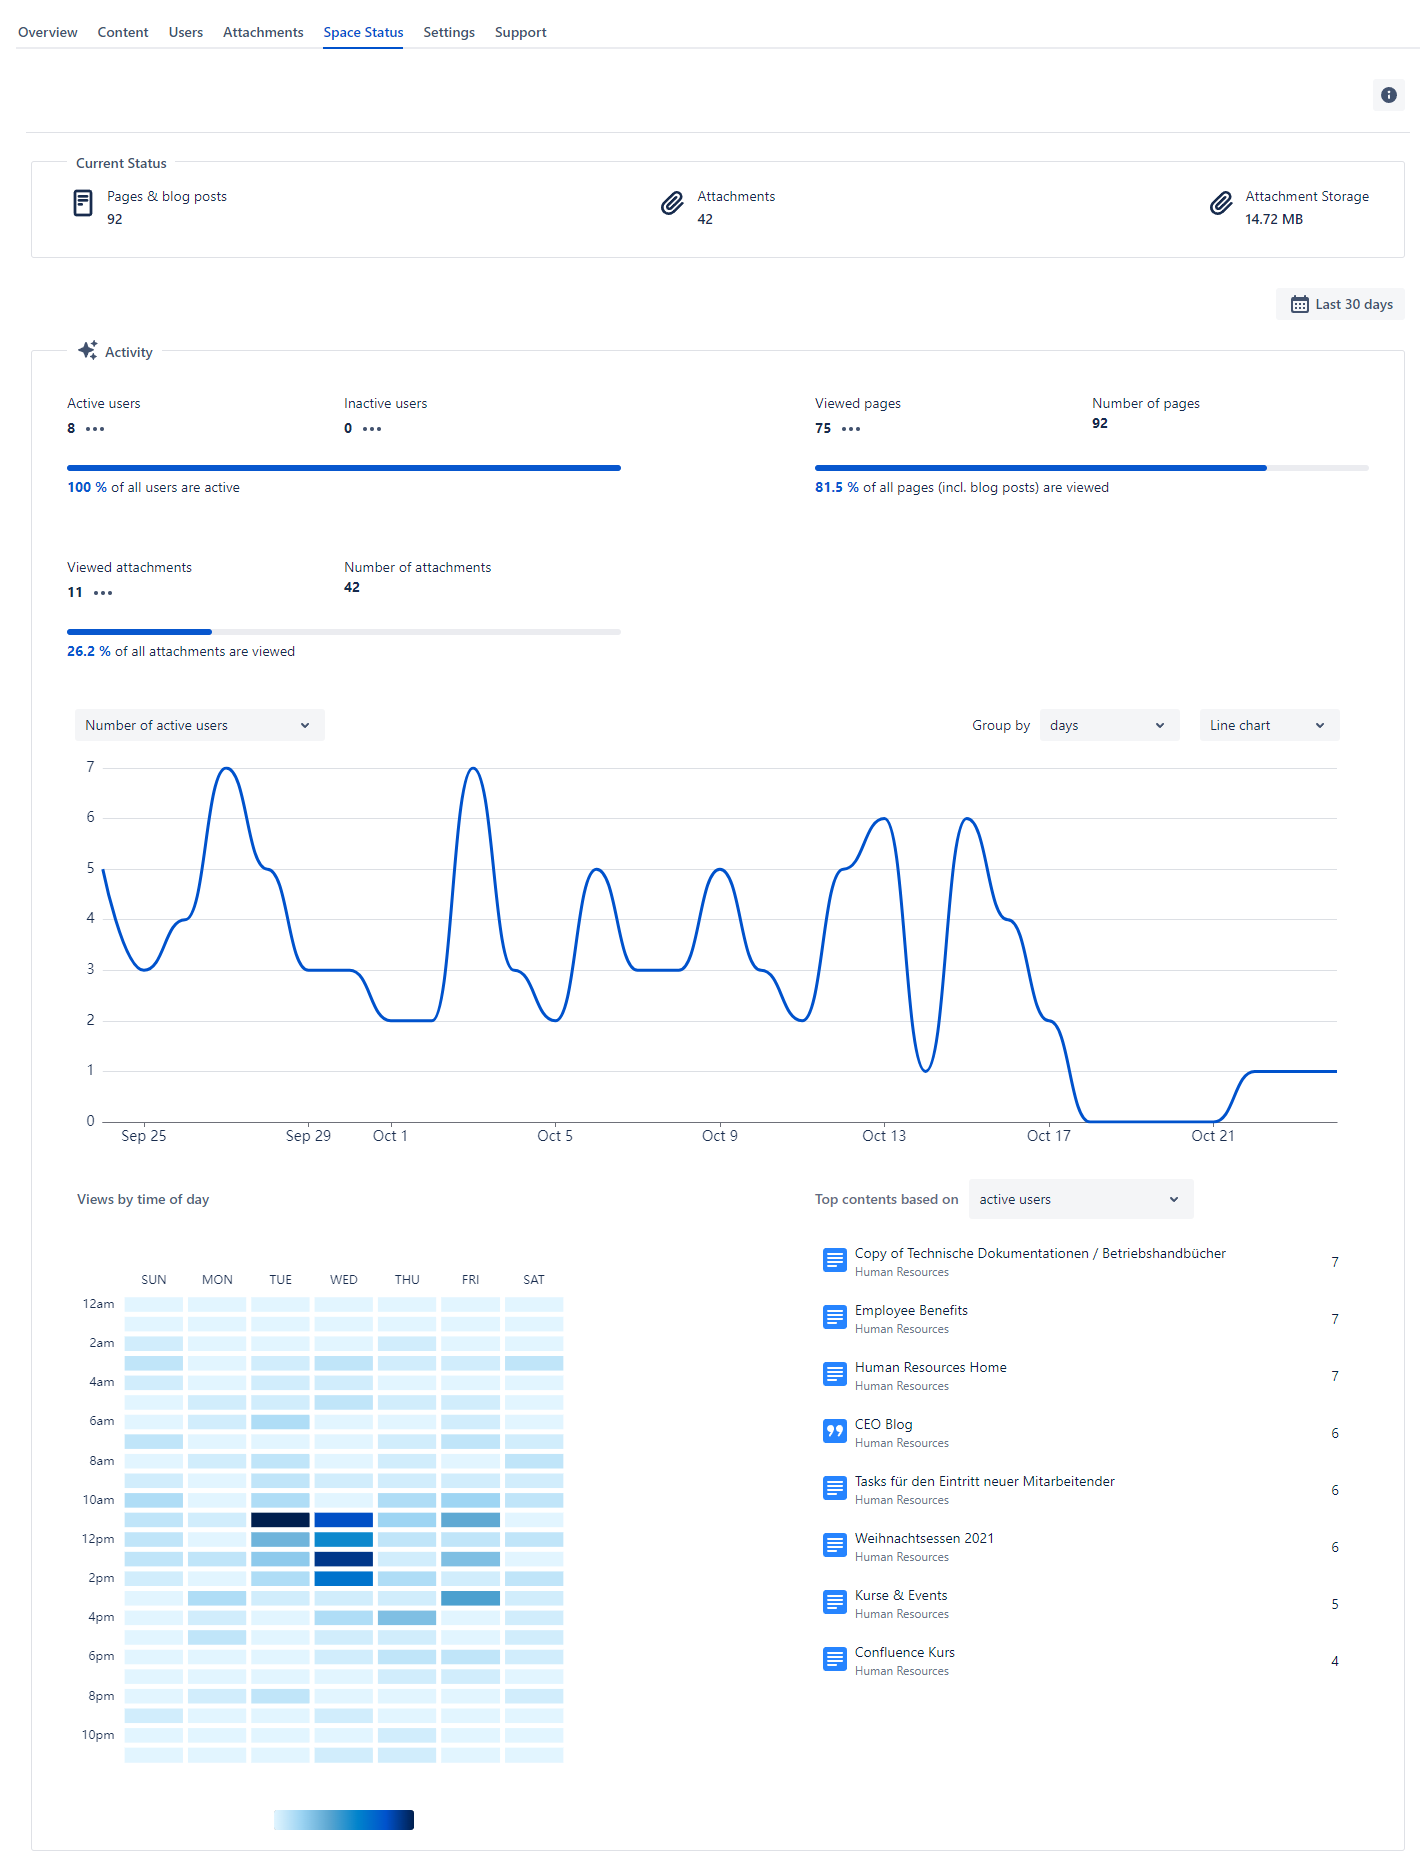
The full report consists of the following components:
Active vs. inactive Users
This will compare active and inactive users and the number of times content was viewed against the total number for the selected date range.

Active vs Inactive users.
Active users have viewed, created, edited, or commented on at least one page in the defined date range for this space and are represented with a percentage as well.
The icon “…” links to this space’s Content & Usage: Users report, which provides a detailed overview of user activities.
If you click next to “Active users,” the report will be filtered for active users.
If you click next to “Inactive users,” the report will be filtered for inactive users.
Viewed pages
This metric displays the number of pages and blog posts viewed in contrast to those not viewed during the defined date range.

The icon “…” links to this space’s Content & Usage: Content report, which provides a detailed overview of pages viewed in the selected date range.
Once there, you can change tfilter to “content without views”.
Viewed Attachments
This section compares the number of viewed attachments to the total number. Only attachments whose file type is tracked by Viewtracker are considered here.

The icon “…” links to this space’s Content & Usage: Content report with the content type filter set to “Attachments” for a detailed overview of viewed attachments.
You can change the filter to “content without views” to see unused attachments.
Chart of different metrics
Some metrics that can be tracked in this report are “Active users,“ “Attachment bandwidth usage,” “Attachment storage,“ “Number of attachments,“ and “Number of content.“
You can display these metrics in Line (default), Bar and Area charts.
You can group the data by days, weeks, months, and years.
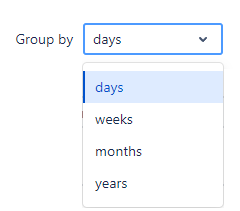
List of time-related options available.
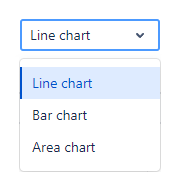
Type of charts available.
The corresponding graphical representation will be displayed for the defined date range.
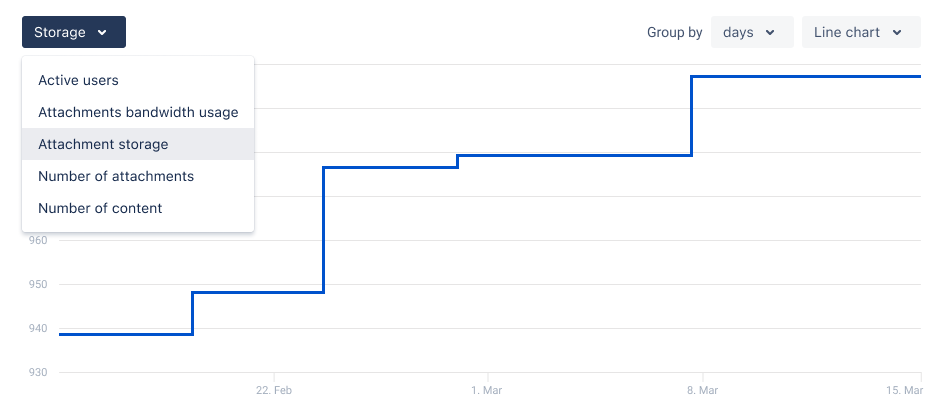
Example of the attachment storage display with line chart
Views by time of day
This overview offers insight into which days and times the Confluence pages (pages and blog posts) in this space are visited most. This helps determine, for example, when to publish important communications or schedule maintenance work.
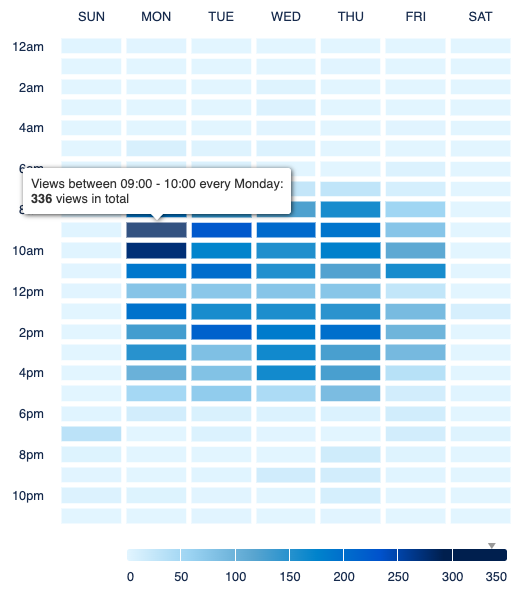
Heat-map available within the Space Report
All views are cumulated in the selected date range's corresponding day and time and displayed as a colored cell. The darker the cell, the more views occur at the corresponding time.
On mouse-over, a tooltip with the cumulative views is listed. Additionally, the view intensity is shown on the scale.
Top content based on …
The default selection is “active users.” Here the 10 content pieces with the most active users in the set date range will be displayed.
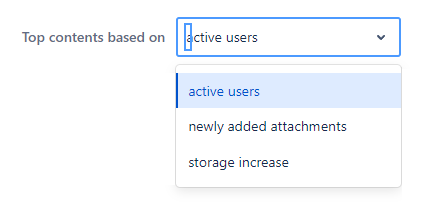
More top 10s can be selected in the drop-down menu:
Newly added attachments
Storage increase
Note: Only attachments whose file type is tracked by Viewtracker are included in this metric.
