📶 Instance Report
Discover how your Confluence instance is developing (includes user count, attachment storage, etc.)
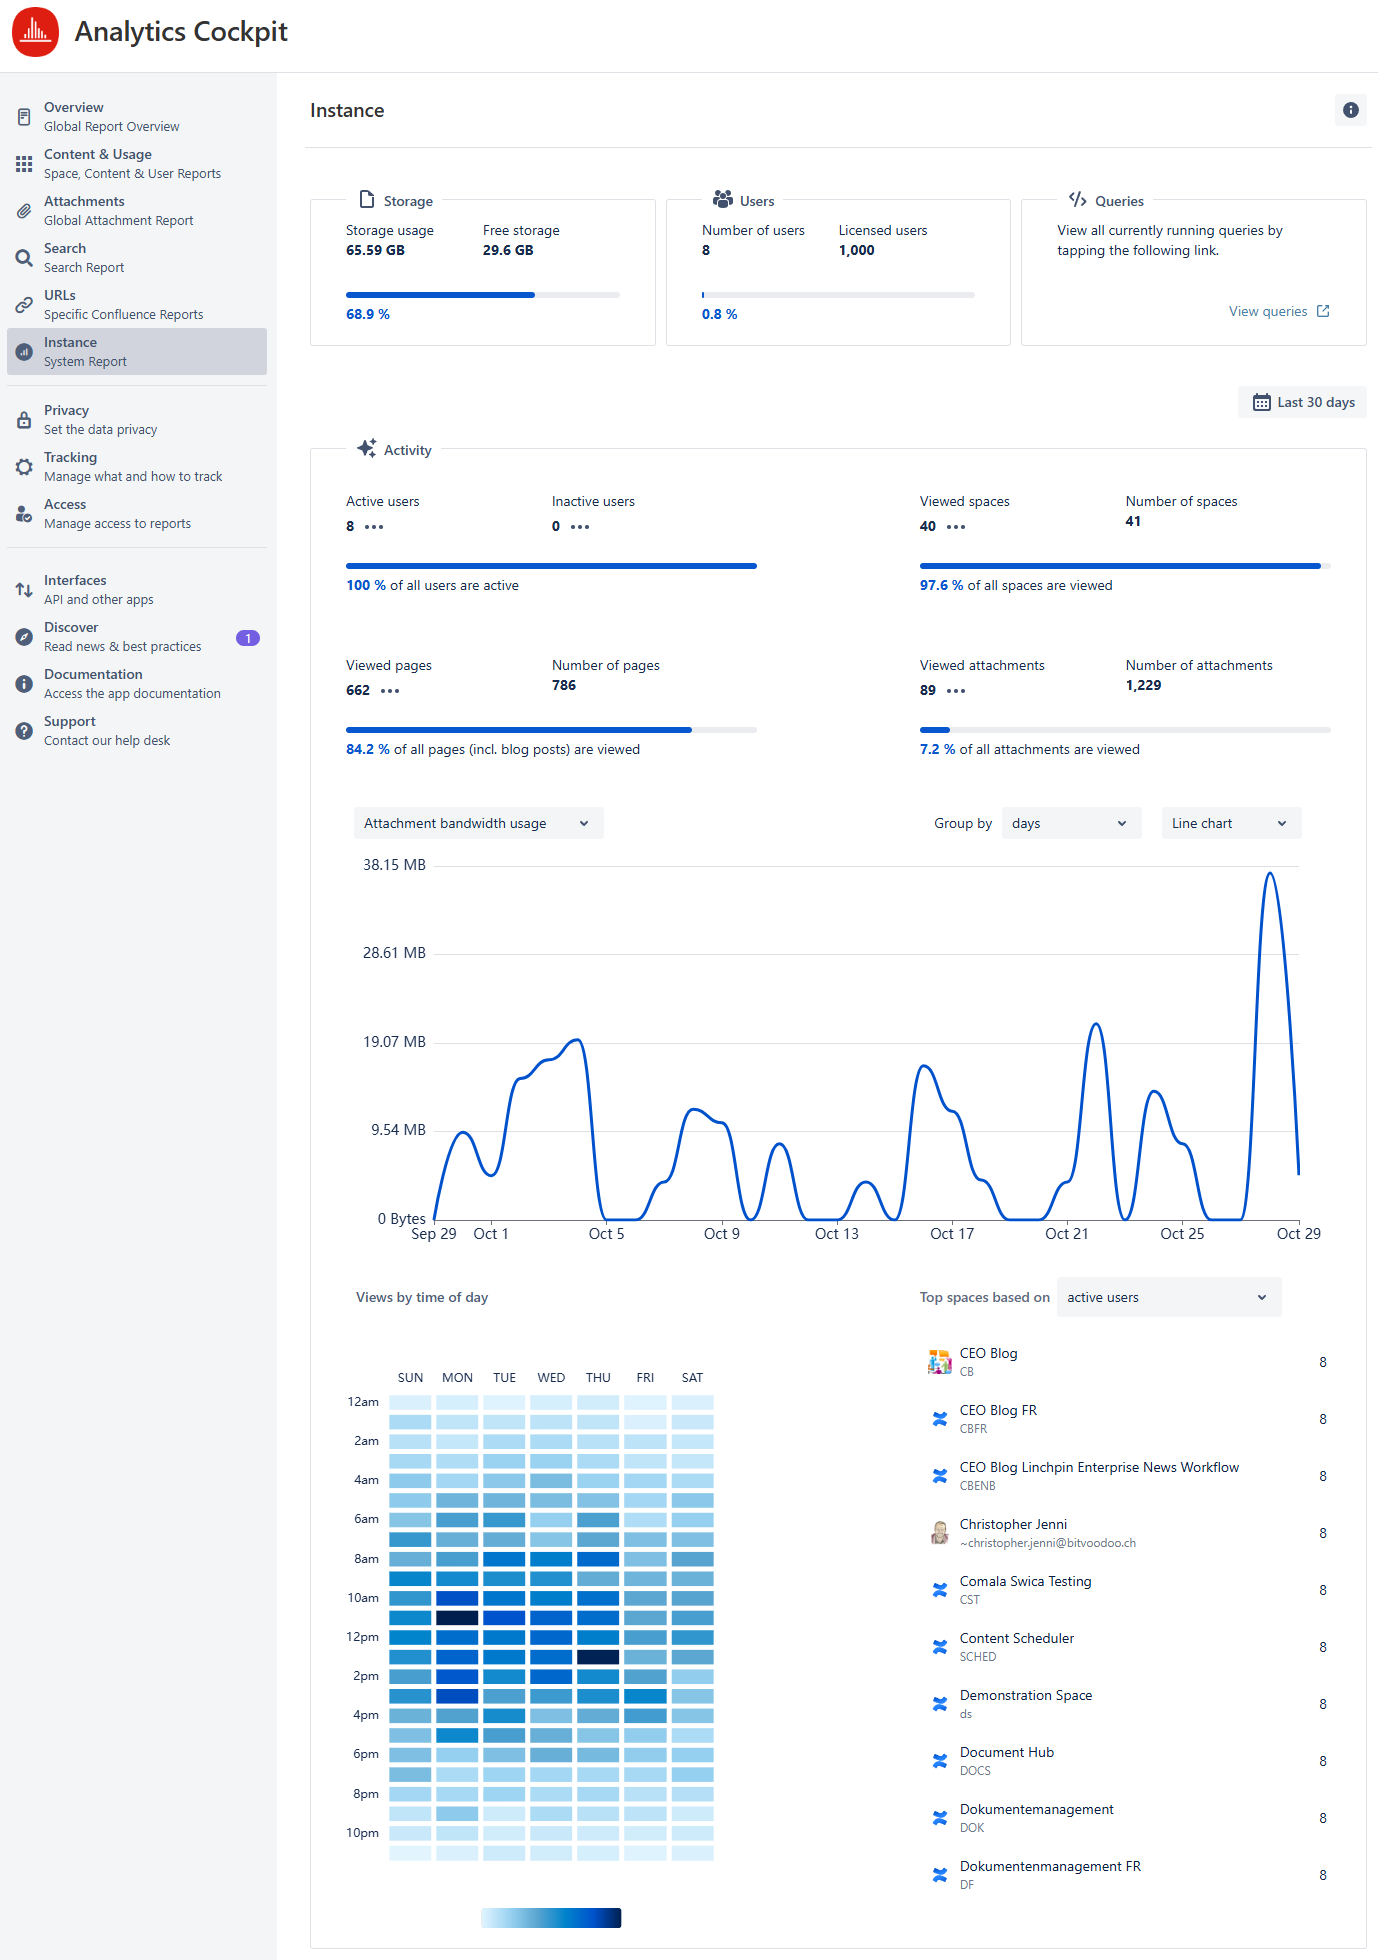
Screenshot of the Instance Report
Accessing the Instance Report
In the Viewtracker menu, select the new entry “Instance/System Report”.
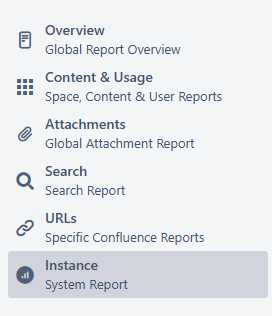
Access entry to the Instance Report
This will open the Instance Report in a condensed version (see screenshot below). Set a date range and tap “Apply” to load the full report with all KPIs.
KPIs in the condensed version:
Current vs. available storage
Current users vs. licensed users
Running queries
(only visible and accessible to administrators).
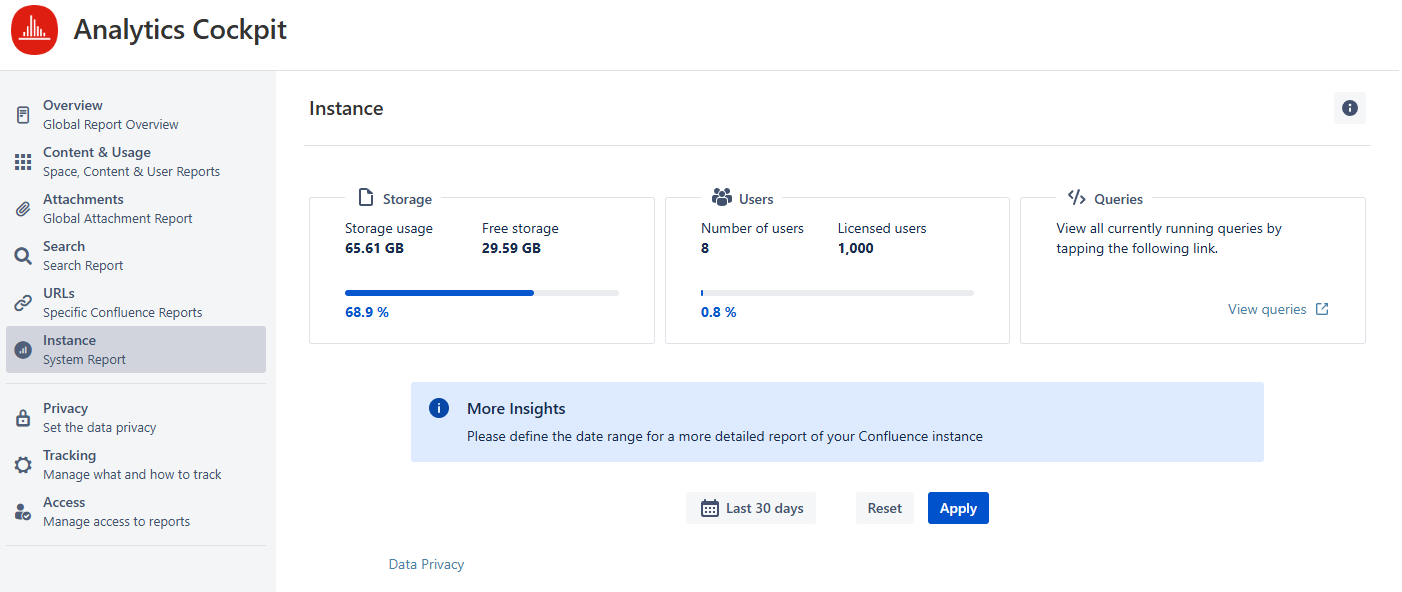
Condensed version of the Instance Report
![]() Note: The “storage” metric reflects where Confluence Home is located and not the Confluence folder itself.
Note: The “storage” metric reflects where Confluence Home is located and not the Confluence folder itself.
Instance Report metrics
The full report consists of the following components:
Active vs. inactive Users
This section lists the number of active and inactive users. Active users have viewed, created, edited, or commented on at least one Confluence page in the defined date range.
The three dots “…“ link to the Content & Usage Users Report for the respective overview of user activities.
The percentage display indicates the active users in the defined date range.
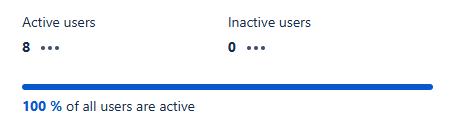
Active users field
Viewed Spaces
This section lists the number of viewed spaces versus the total number of spaces. A space view is counted if at least one of the space contents has been viewed in the defined date range.
The three dots “…“ link to the Content & Usage Spaces Report to get a detailed overview of spaces that were viewed/not viewed.
The percentage info indicates the viewed spaces during the defined date range.
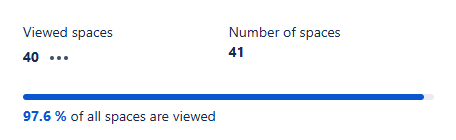
Viewed Spaces field
Viewed Pages
Similar to the previous section, the number of pages and blog posts viewed is compared to those not viewed during the defined date range.
The three dots “…“ link to the Content & Usage Content Report for a detailed overview of pages that were or weren’t viewed.
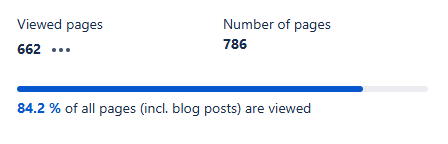
Viewed pages field
Viewed Attachments
This section compares the number of viewed attachments to the total number. Only attachments whose file type is tracked by Viewtracker are considered here.
The three dots “…“ link to the Content & Usage Content Report with the content type filter set to “Attachments” for a detailed overview of attachments that were or weren’t viewed.
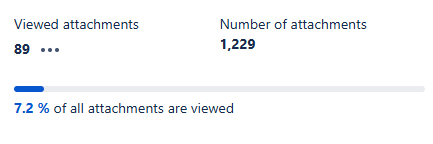
Viewed attachments field
Chart of different metrics
The corresponding graphical representation is displayed for the defined date range.
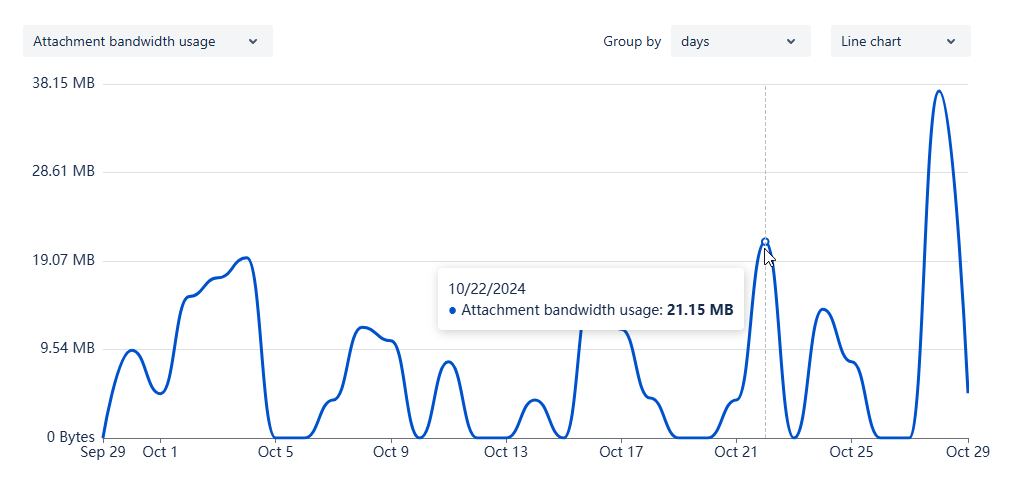
Screenshot of the Instance Report chart
Some of the metrics listed above can also be displayed in a chart (see below), and grouped by days (default), weeks, months and years, as well as displayed in line (default), bar or area charts.
Metrics available in this dropdown:
Number of active users
Attachment bandwidth usage
Number of attachments
Number of contents
Number of spaces
Number of user accounts
Storage
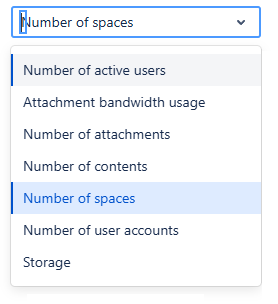
Screenshot of the available metrics
Available time group filters
Available chart types
Views by time of day
This overview provides insights into the days and times when Confluence pages (including pages and blog posts) receive the most visits. This information can help you determine optimal times for publishing important communications or scheduling maintenance work.
All views are aggregated for each day and time within the selected date range and are displayed as colored cells. The darker the cell, the higher the number of views during that time.
When you hover over a cell, a tooltip will display the cumulative view count. Additionally, the intensity of views is represented on a scale.
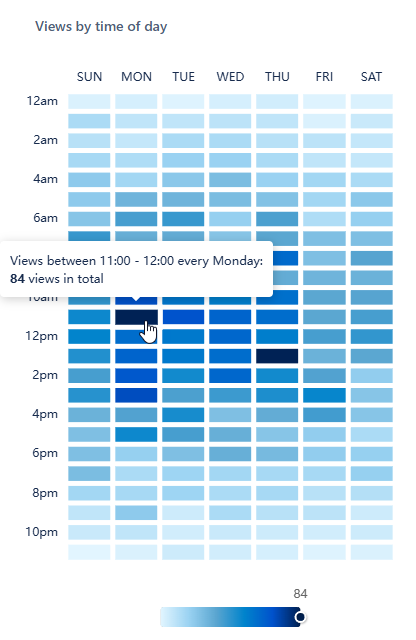
Screenshot of the heat-map within the Instance Report
Top spaces based on …
This section lists the top 10 spaces within the selected date range based on the number of attachments, ranked by file size.
Please note that only attachments tracked by Viewtracker are included.
More top 10s can be selected in the drop-down menu:
Active users
New pages and blog posts
Newly added attachments
Storage increase
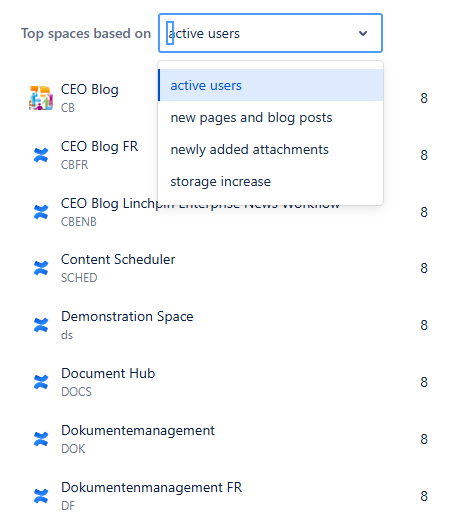
Screenshot of the top spaces field
Running queries
This report is only accessible to administrators.
Click “View Queries” to see all currently running Viewtracker queries, which generate the various reports. Administrators can cancel individual queries or all running queries if needed.
The list updates every 30 seconds, removing finished queries. It contains:
Query name
Start date and time of the query
Duration in min:sec
Actions
You can cancel any query by tapping the cross in the column “Actions” and confirming the action.
If necessary, you can cancel all running queries by tapping the button “Cancel all queries”.
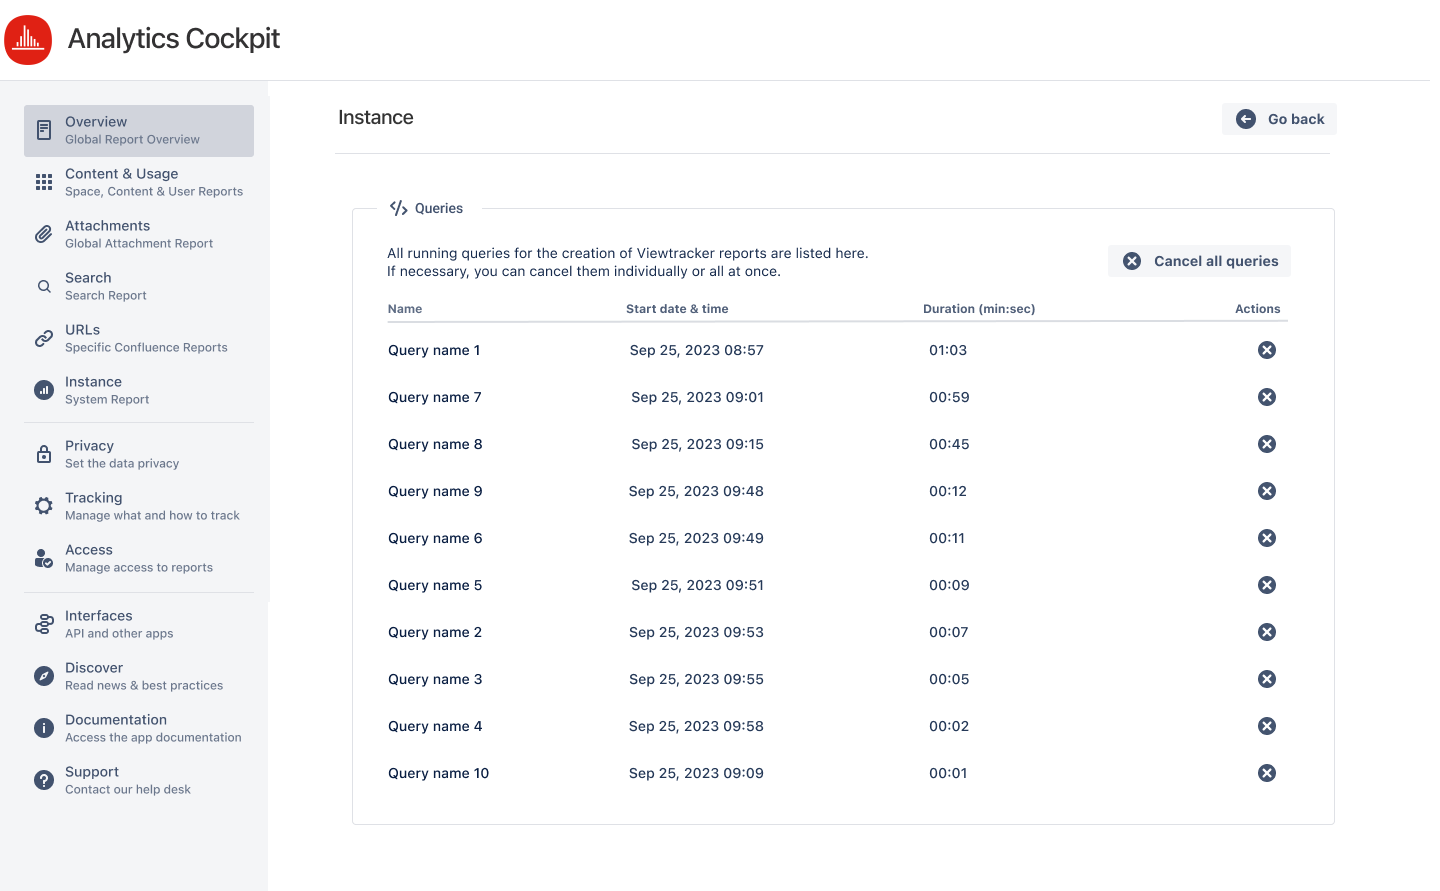
Screenshot of the Queries report
Related content
For a very similar report on a specific space, use the Space Status Report.
For a general overview of Confluence usage, use the 🌐 Global Report.