📁 Space Report
What can the Space Report do for you?
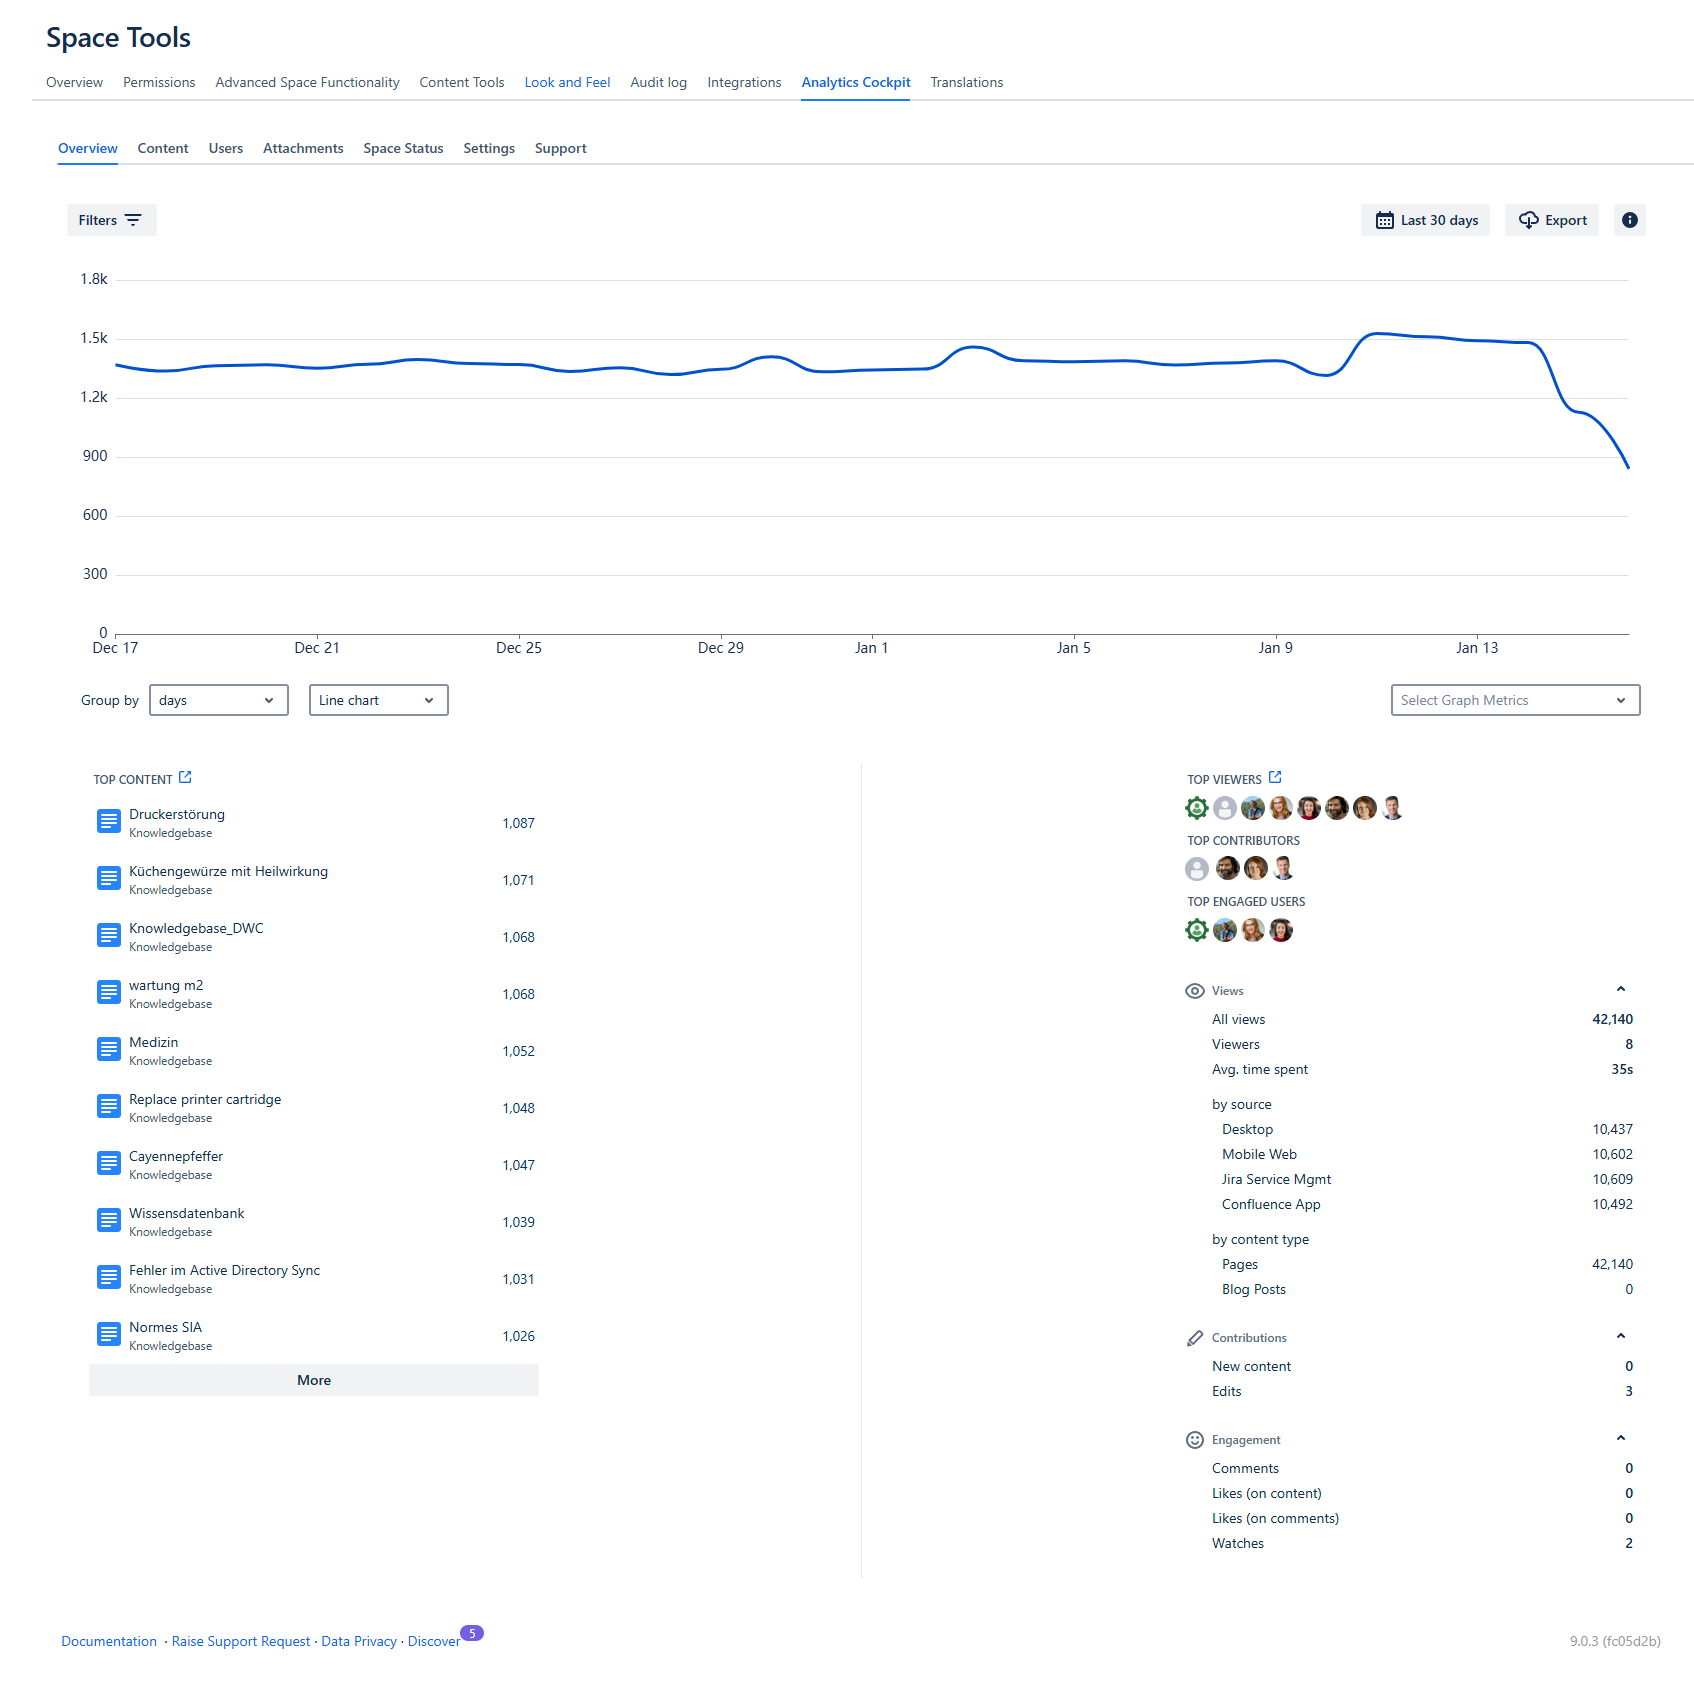
See this space's total number of views, likes, edits, etc.. Drill down the numbers by accessing the Content & Usage Report.
See the number of attachments of this space and their number of views.
Select different date ranges and see the metrics and graph adapt accordingly.
Group the metrics in the graph by days (default), weeks, months, or years. Change the graph style to Line, Bar and Area charts.
Grant a specific group access to the Space Report.
Filter the data by source (desktop, mobile, Jira Service Management etc.), content type (page, blog post), and login state.
Additionally, filter the data with the CQL filter.
Determine the most popular (most viewed) content in your space
Determine the most active users (with most visits) in your space (depending on the privacy settings).
Determine the average time users (logged-in Confluence users, anonymous visitors, and readers of the Jira Service Management knowledge base) spend viewing or interacting with Pages & Blog posts across your instance. See Tracking settings.
Export your data as a CSV file.
Accessing the Space Report via Analytics Cockpit
You can access the space report by navigating to a specific space and choosing ⚙ Space Tools → Analytics Cockpit.
The Space Report contains the following sections:
Tab "Overview" (default):
A customizable graph displaying the number of views, edits, and creations.
Information and metrics on the number of likes, blog post views, etc., which can be filtered (see below).
Sections for “Top Content,” “Top Viewers,” “Top Contributors,” and other metrics (views, contributions, engagement).
Tab “Content”: detailed information on the content of the space; see Content & Usage Report: Content
Tab “Users”: detailed information on the users of the space; see Content & Usage Report: Users
Tab "Attachments":
A graph displaying the number of attachment views
Table with the list of attachments in this space and the number of their views.
Tab "Settings": settings to disable tracking and grant access to the report (see below).
Tab "Support": How to create a Support Zip.

Tabs visible within the Space Report
![]() If you want to see all the data of your Confluence instance (access right provided), access the Global Report.
If you want to see all the data of your Confluence instance (access right provided), access the Global Report.
Metrics in the Space Report
All metrics apply to the selected date range (default: 30 days) and the chosen space.
Top content: The top 10 pages or blog posts, sorted by the number of views. Tap the “More” button at the end of the list to load 10 more results (if available).
Click on any title to the Content Report of the page.
Tap the link in the header to access the detailed content report.
Top viewers: The users who created the most views in this space. Click on their icons to learn more about them.
Tap the link in the header to access the detailed user report.
Top contributors: The 10 most active users (by edits, creations) in this space
Top engaged users: The 10 most engaged users (by likes, comments and watches) in this space
Views
all views: all views accumulated in the selected date range
Viewers: see What are Viewers?
Avg. time spent: the average time a user (logged-in Confluence users, anonymous visitors, and readers of the Jira Service Management knowledge base) spent viewing or interacting with Pages & Blog posts across your instance. Note: Attachments are excluded from this metric. See Tracking settings.
by source: see Source Tracking
by content type: pages and blog posts
Contributions
New content: pages and blog posts newly created
Edits
Engagement
Comments
Likes (on content)
Likes (on comments)
Watches
Granting access to the Space Report
You can grant users without space administrator rights access to the Space Report. This feature has existed since version 7.
Click on ⚙ Space Tools → Analytics Cockpit → Settings.
In the field "Report Access", start typing the name of a Confluence user group. The group will be saved automatically.
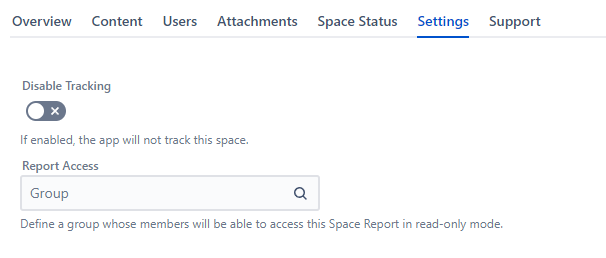
Screenshot demonstrating settings available for the Space Report.
Members of the selected group can now access the Space Report by clicking on ⚙ Space Tools → Analytics Cockpit. However, they cannot access the settings.
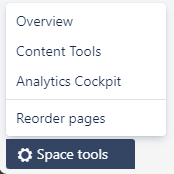
Screenshot: access menu of a user with permissions.
Alternatives:
If you need more than one user group to see the Space Report, you can use the Analytics Report Macro instead, which can display a wide variety of metrics.
If you want to grant users access to the Global Report instead, read the Global Report documentation.
Filtering the Space Report Overview
If you are interested in specific sources or other metrics, you can use the pre-defined filters:
Filter by content type (page vs. blog post).
Filter by source; see Source Tracking.
Filter by user’s login type: Select “Logged-in Users” or “Anonymous Users”.
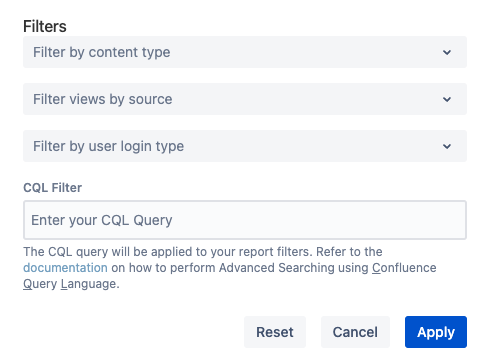
Screenshots of the filters are available in the Space Report Overview tab.
You can also enter your own CQL filter.
Tap the "Filters" button and enter a valid CQL query. You can read all about advanced searching using CQL on Atlassian's documentation.
Example: You want to filter for pages carrying the label "meeting-notes". You enter this string into the CQL Filter and tap “Apply”.
- CODE
label = "meeting-notes"
Info on CQL Filter
To avoid performance problems, the CQL filter will only work for a maximum of 10,000 results.
The filter(s) will also be present in the export.
Content & Usage Report: Content & Users
Select the tabs “Content” or “Users” for a detailed report.
Read all about the report on the dedicated pages:
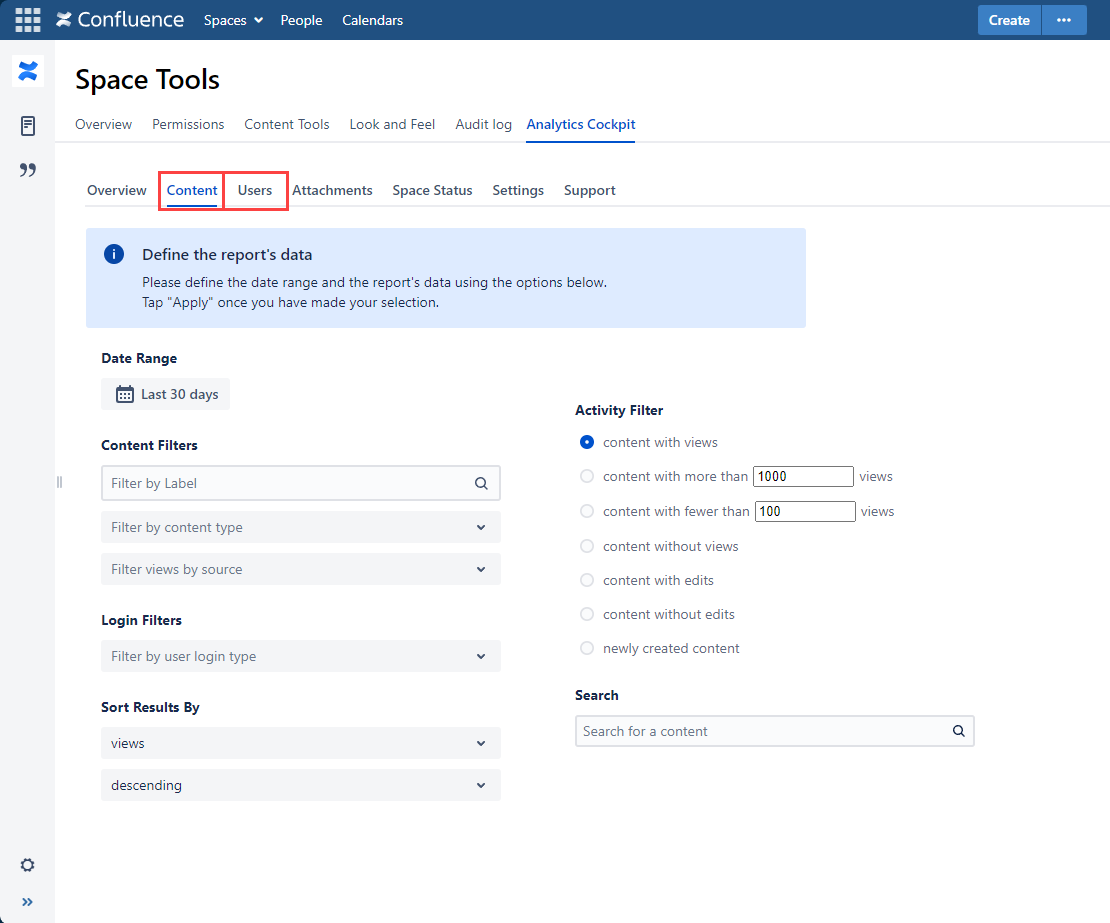
Screnshoot demonstrating the Analytics Cockpit view within Space Tools.
Attachments Report
By selecting the tab “Attachments,” you will see a list of viewed attachments within the chosen space.
The graph and table can be adjusted by selecting a different date range (default = 30 days).
The type of attachments displayed in the list depends on the Attachment Tracking Settings.
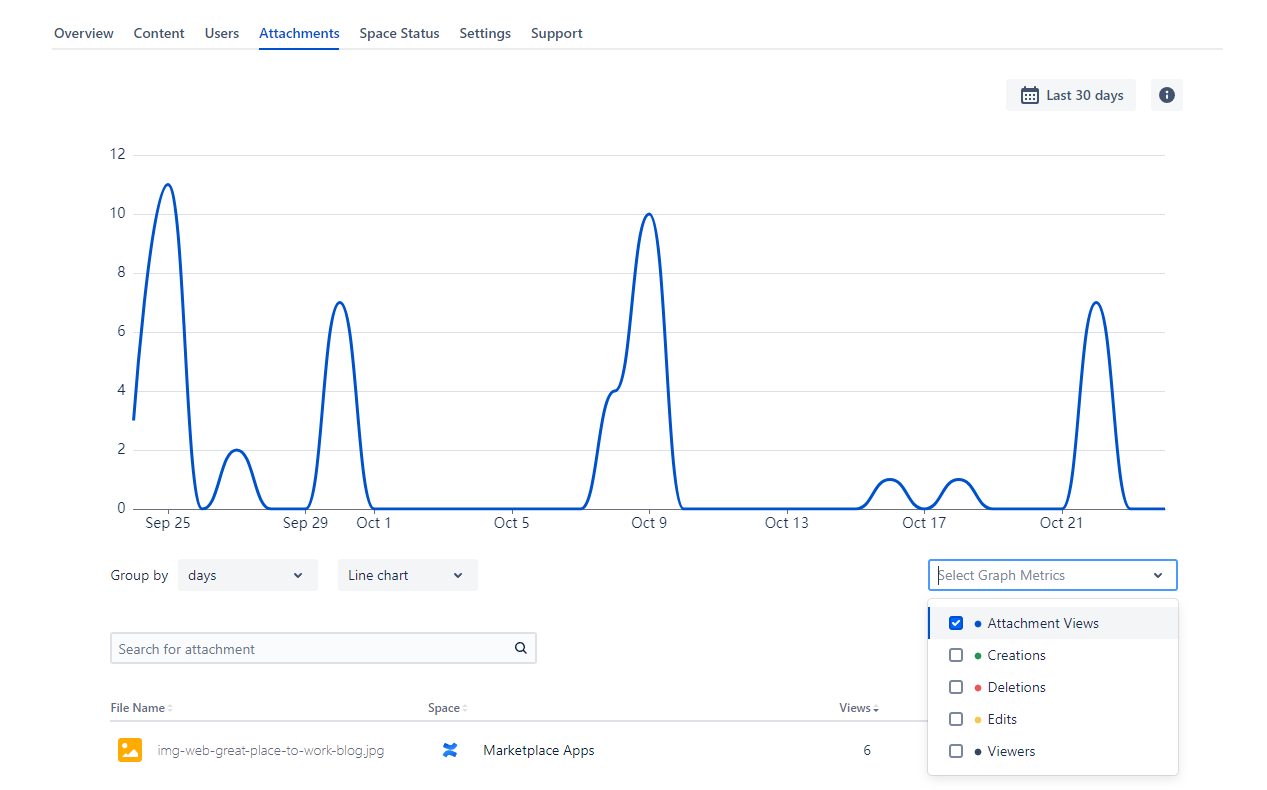
Screenshot displaying the Attachment Report on Space level.
Settings and filters:
You can group the metrics in the graph by using “Group by” days (default), weeks, months, or years.
Additionally, change the chart style to Line, Bar or Area chart.
Use the search field to search for specific attachments.
Use the drop-down menu listing the available metrics. By default, “Attachment Views” are selected. Select the metrics you want in the graph (Attachment Views, Creations, Deletions, Edits, Viewers).
Changing the date range and graph type
By default, data from the last 30 days are displayed. You can change that by clicking into the date field and selecting a different date range. All metrics will adapt automatically.
You can group the metrics in the graph using “Group by” days (default), weeks, months, or years.
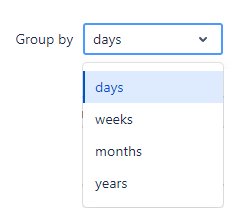
Screenshot: Filter group by days
You can also display the numbers as a line chart (default), bar chart, or area chart.
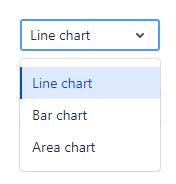
Screenshot: Chart types available
Choosing which metrics to display in the graph
Below the graph, there is a drop-down menu listing the available metrics. By default, “Views,” “Creations,” and “Edits” are selected.
Viewtracker saves the metric selection; whenever you access the report in the future, the selected metrics will be displayed in the graph.
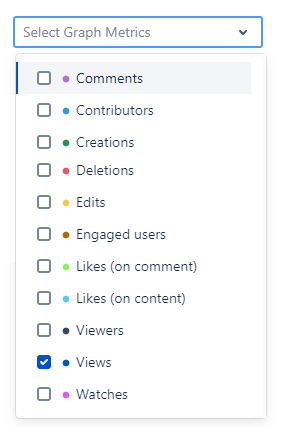
Screenshot: Metrics available for the Graph.
Navigating to other reports
You can access many other Viewtracker reports out of the Space Report.
Taping on the page name in the “Top content” column will open an overlay with the Content Report of that specific page.
The breadcrumbs can lead you to the Global Report or back to the Space Report.
The entry on the right side of the breadcrumb is the page/blog post name. Tapping the name will open the page in a new tab, allowing you to access its content.

Screenshot highlighting the breadcrumbs.
Tap the link next to “Top Content” in the header to access the detailed content report.
Tap the link next to the “Top Viewers” in the header to access the detailed user report.

A screenshot highlighting shortcut access to the Content and User report.
The date range and metric grouping selected in one report will automatically be adapted to the other reports.
Saving and sharing reports
Once you’ve applied a filter or changed the report's date range, the report’s URL will adapt with parameters like
?dateValue=this.week&contentType=blog.This is useful for the following reasons:
You can copy and share the URL with co-workers with the same access permission.
You can save the URL to access a customized report quickly.
Exporting reports
To export the Space report, head to:
Space Tools → Analytics Cockpit → Content → Export and choose between Views, Edits or Creations.
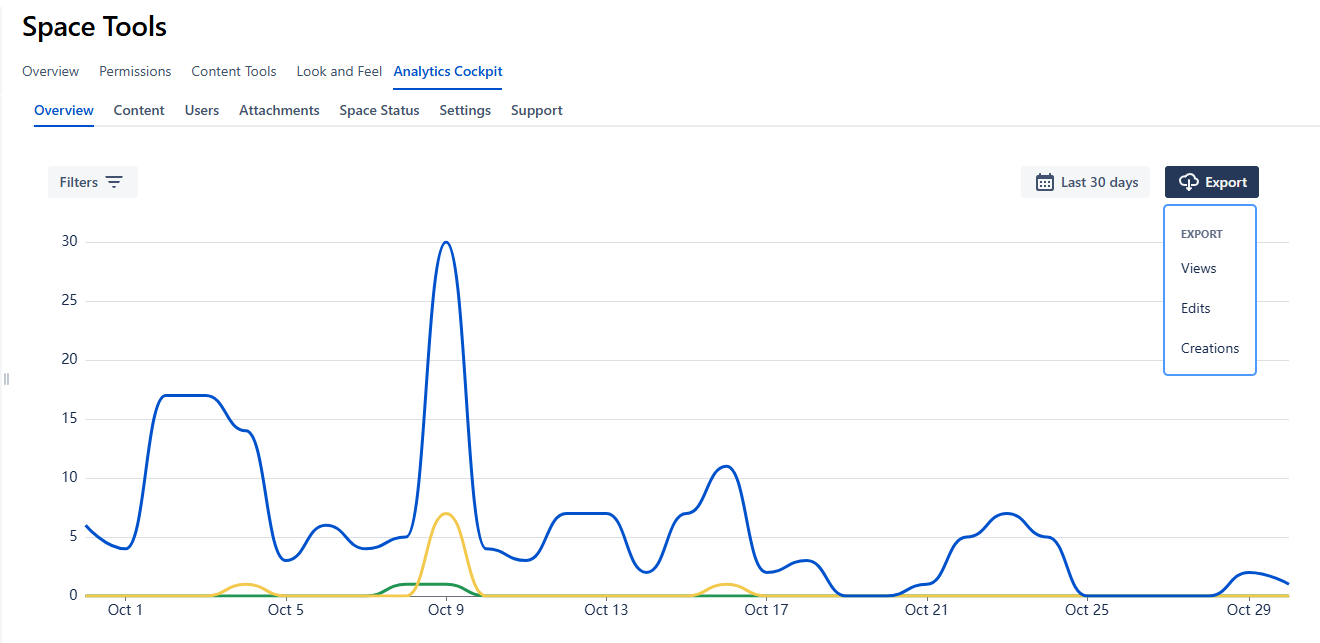
Export options for the Space Report
Exporting Views
This exported CSV file will contain the following categories:
Visit ID, Username, Full Name, Content Id, Content Title, Content Type, Source, Space Key, Space Name, Visit Date, UNIX Date
Exporting Edits
This CSV will contain:
ID, Username, Content Title, Content Type, Space Key, Space Name, Date, Unix Date
Exporting Creating
This last CSV will contain::
ID, Username, Content Title, Content Type, Space Key, Space Name, Date, Unix Date
