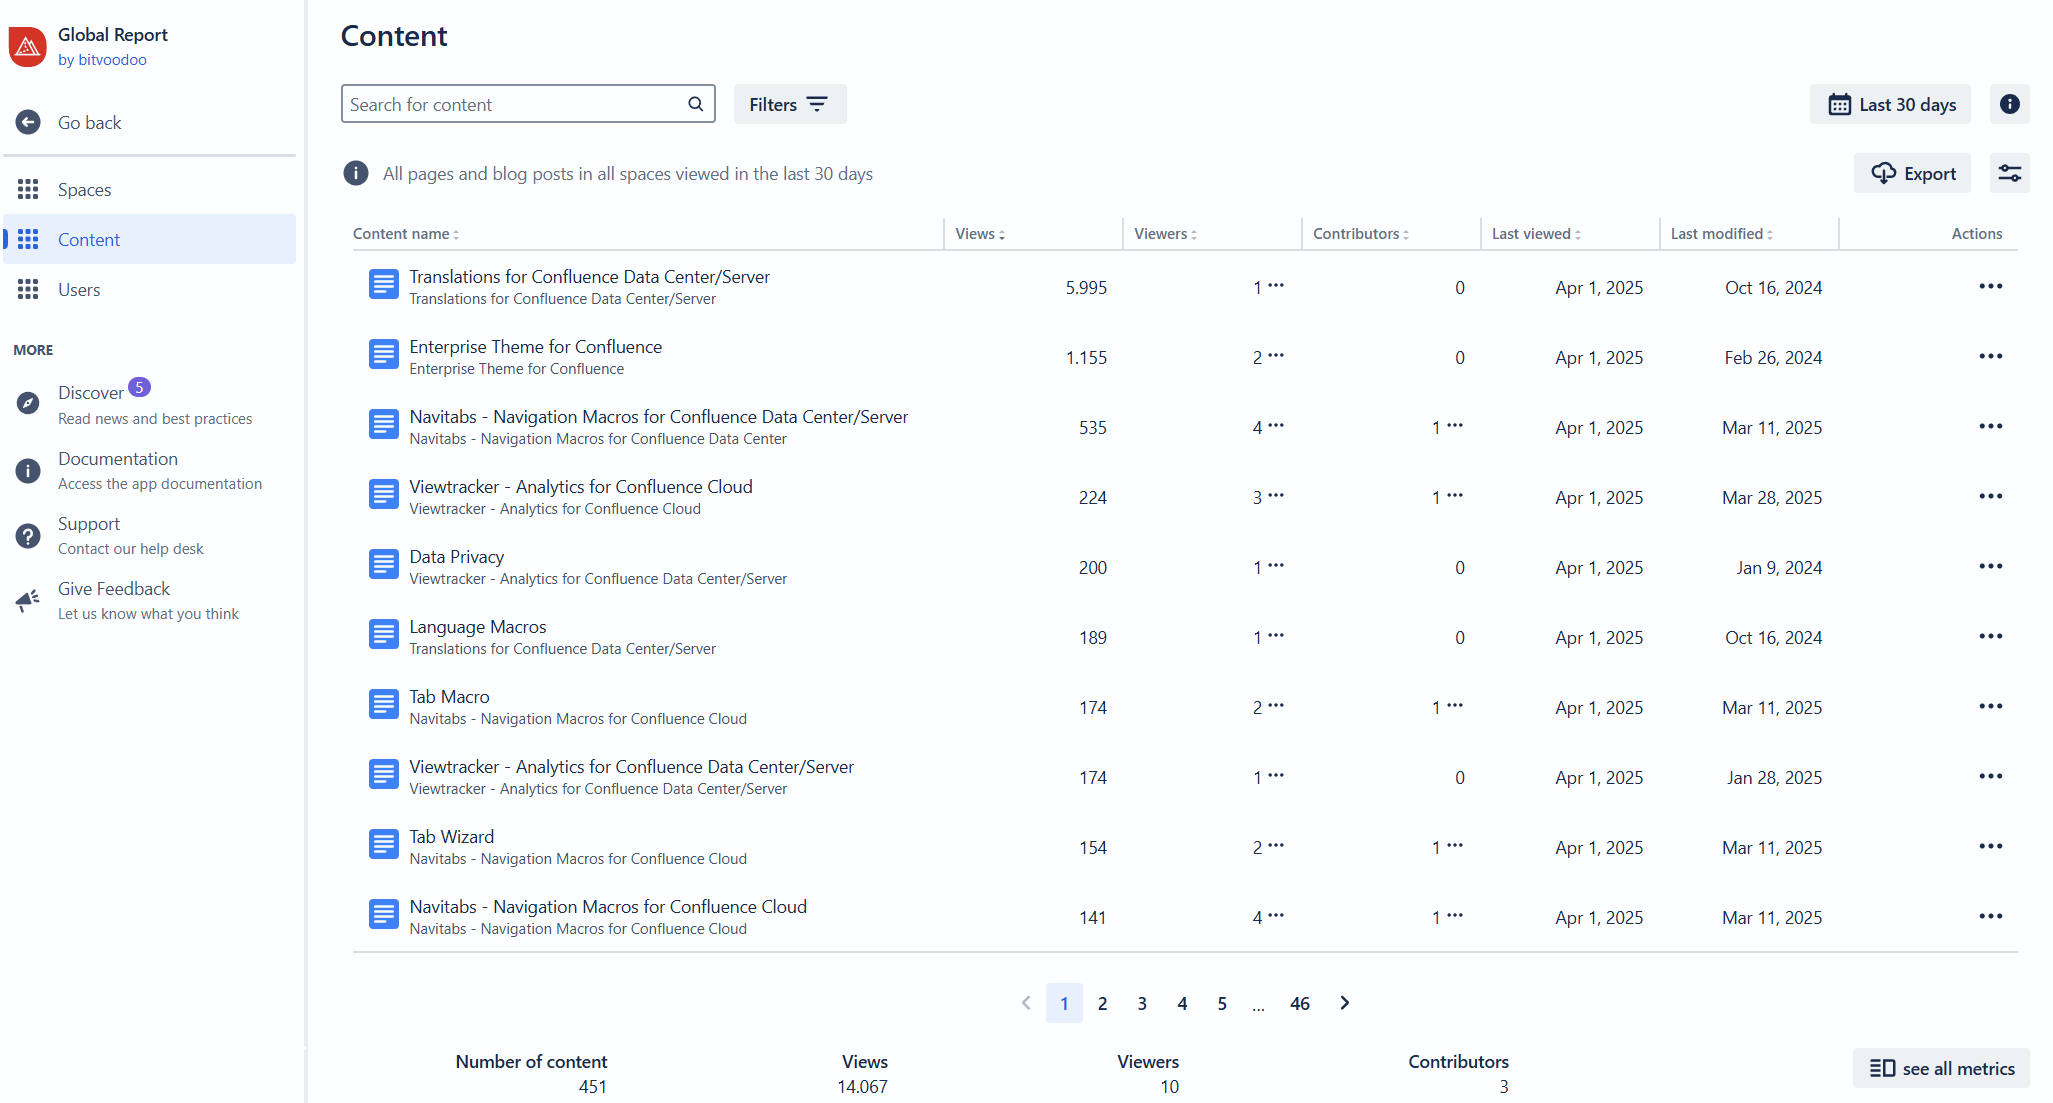
Content & Usage Report: Content
List all content in your Confluence instance and how much it is used in a specified date range.
Accessing the Content & Usage Report: Content
This report can be accessed at the Global and Space levels.
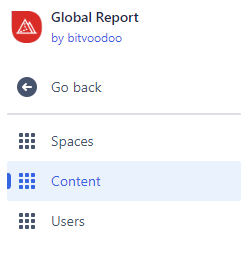
To access this report on a Global level. Locate and access the ”Viewtracker Global Report” in the top navigation bar, then “Content & Usage“ and finally “Content.“
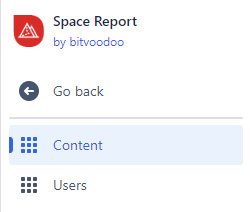
To access this report on a Space level. Locate and access the ”Space Report” in the sidebar navigation bar, then “Content & Usage“ and finally “Content.“
Content & Usage Report: Content
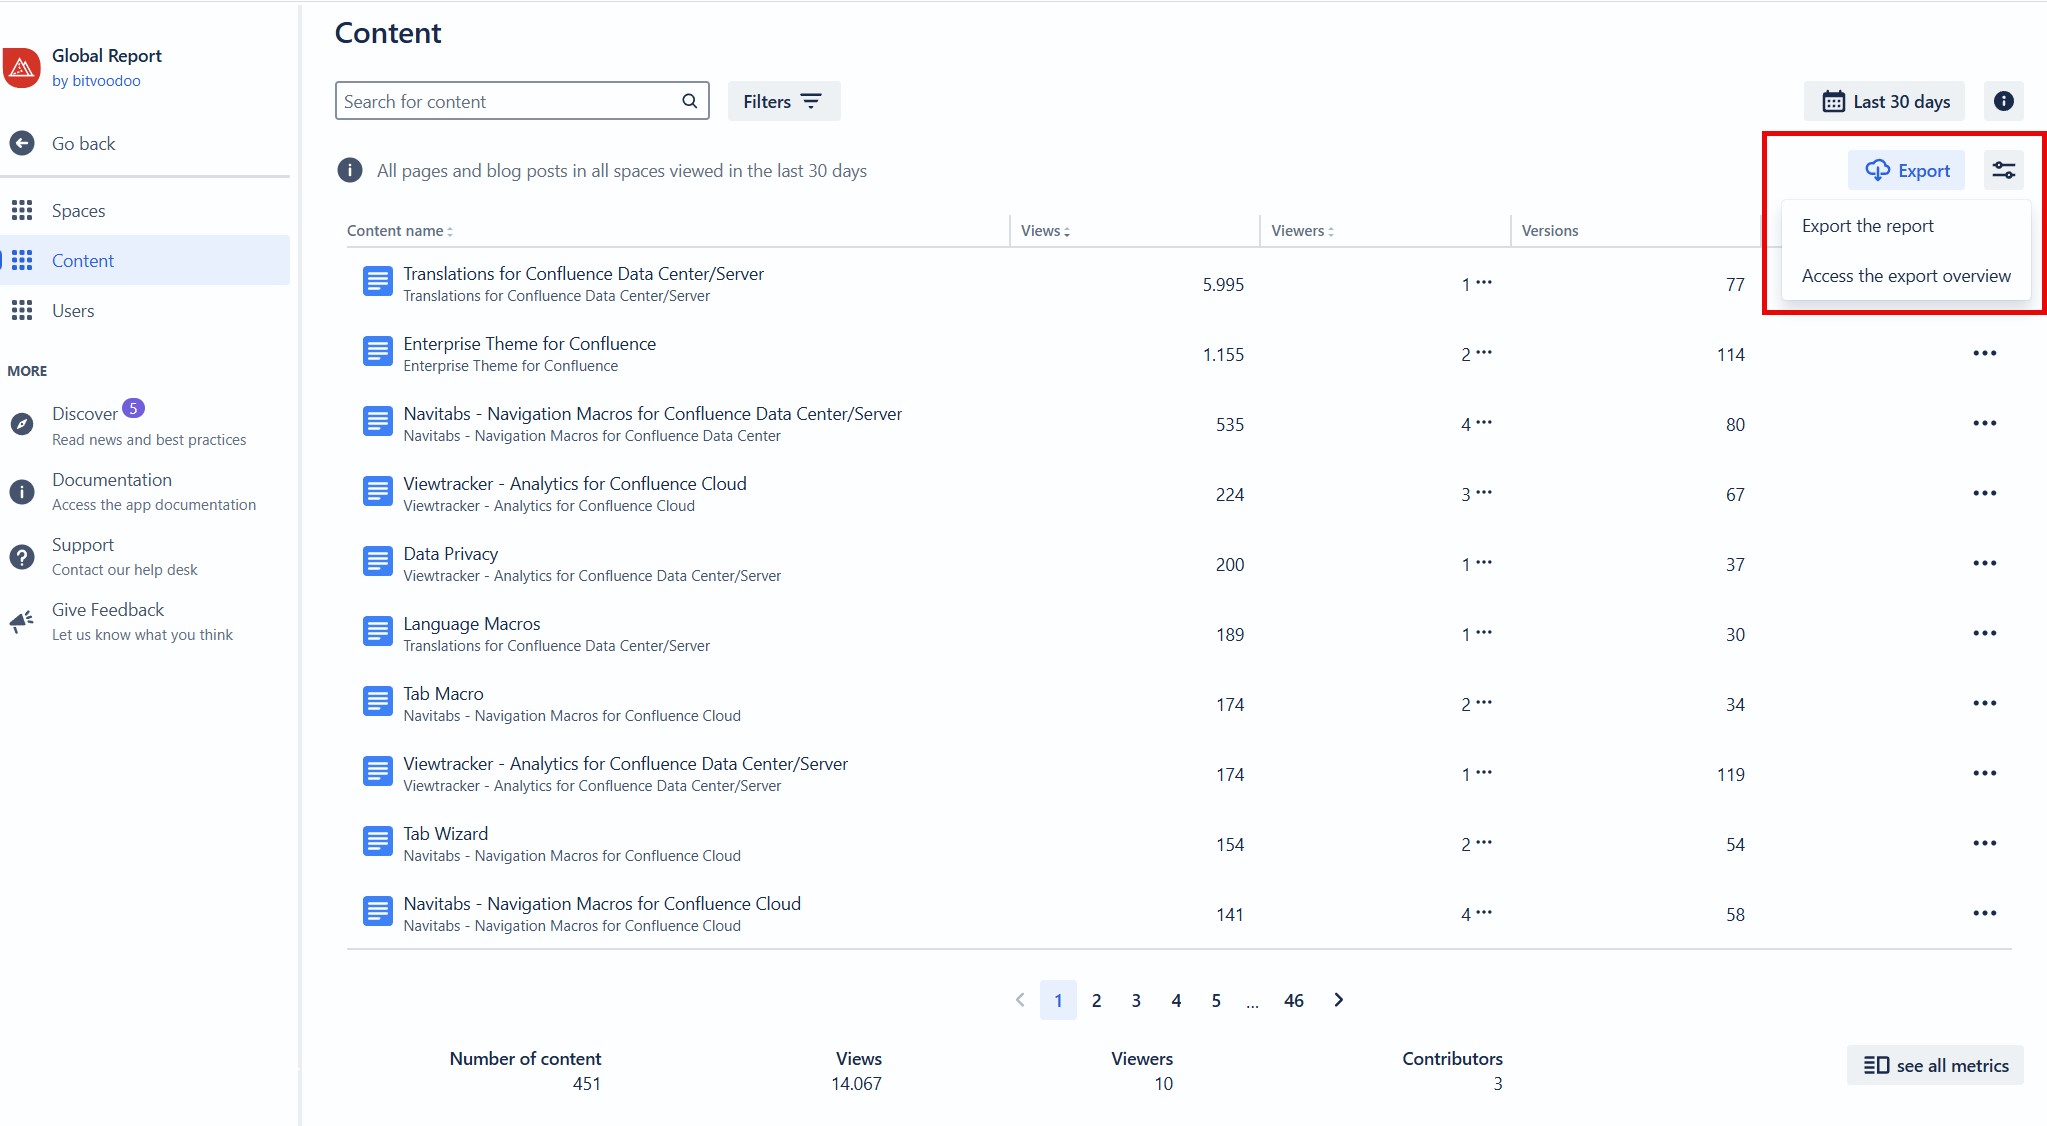
By default, the table is sorted by Views in descending order (from most views to least). You can re-sort the table by clicking on any column header.
The content names are linked to the respective content (page/blog post/attachment). When clicked, the Content Report of that page opens in a new browser tab.
You can customize the table by adding, hiding, or reorganizing metrics. Click the configuration icon on the top right of the table to choose from the available options (at least one metric must be selected).
Attachment views
Comments
Content ID
Contributors
Creator
Edits
Last editor
Last modified
Last viewed
Number of attachments
Owner
Page status
Publishing date
Restrictions
Versions
Viewers
Views
![]() Note: The metrics you have selected to display in the table will also be reflected in the exports.
Note: The metrics you have selected to display in the table will also be reflected in the exports.
Scope of data
Whenever the word “content” is used, it refers to pages, blog posts and attachments.
This report will not list content in spaces that have been excluded from tracking.
By default, this report only lists content with at least one view or edit since the Viewtracker installation.
With content synchronization, an administrator can include content that has never been viewed or edited since the Viewtracker installation.
It can take up to 1 minute before recent views are displayed in the report.
Filters
You can filter the report using the following options:
Search Field: Enter a keyword or string to filter by page titles, blog post titles, or attachment names.
Powerful Filters: Choose from advanced filtering options, which are explained in detail below.
![]() Note: All filters are applied within the selected date range.
Note: All filters are applied within the selected date range.
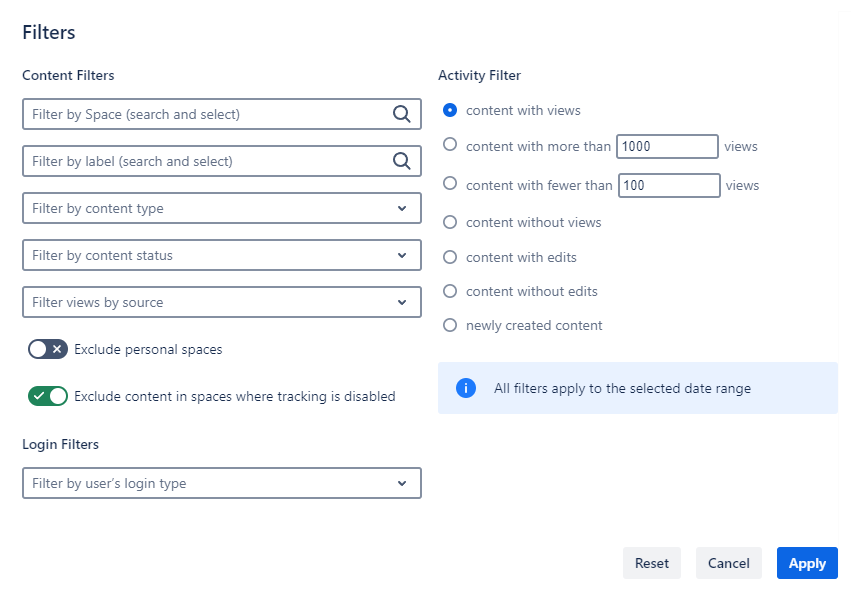
Content Filters
Filter by space: Type and select one or various spaces.
Filter by label: Type and select between one or multiple labels.
Filter by content type: Select content type “pages”, “blog posts” or “attachments”. By default, pages and blog posts are listed in the report. Use this filter to drill down into the various content types.
Filter by content status: Select “Current” or “Archived.”
Filter views by source: Select “Confluence” or “Scroll Viewport.”
Toggle: “Exclude personal spaces” (inactive by default)
Toggle: “Exclude content in spaces where tracking is disabled” (active by default)
Login Filters
Filter by user’s login type: Select “Logged in Users” or “Anonymous Users.”
Activity Filter
Content with views: Only display content with views within the selected date range.
Content with more than 1000 views: Type in any other number of views to see popular content.
Content with fewer than 100 views: Type in any other number of views to see content with few views.
Content without views: Only display content without views within the selected date range.
Content with edits: Display content that was edited within the selected date range.
Content without edits: Only display content not edited within the selected date range.
Newly created content: Only display content created within the selected date range.
📖 Read possible use cases for this report in our blog post on bitvoodoo.app.
Summary
There is a summary below the Report’s table, consisting of the following data:
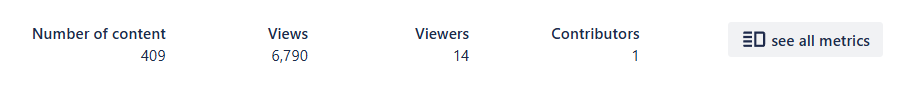
Number of content: The number of content units in the selected filter (can be pages, blog posts and attachments)
Views: All views of all content accumulated within the selected date range, whether it’s actively used or trashed
Viewers: All Viewers who have accessed the content within the selected date range:
Views of all anonymous visitors (users without Confluence login) are tracked and grouped under the user "Anonymous".Contributors: The number of Confluence users who have contributed to the content within the selected date range
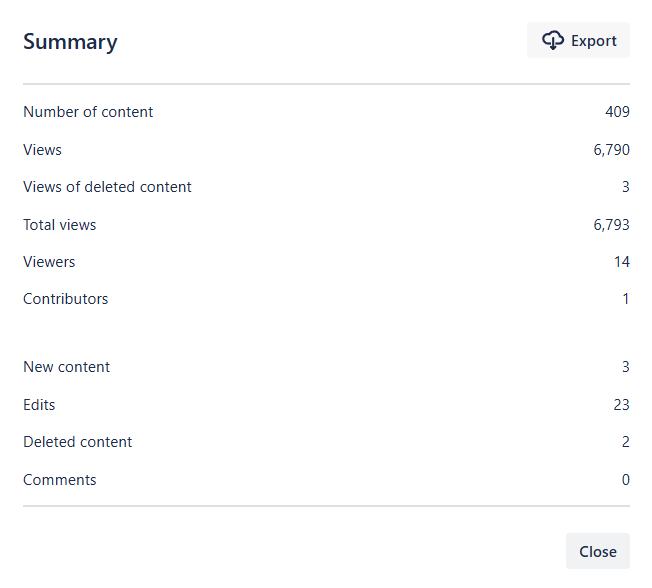
All metrics summary
There are more metrics than those mentioned above. Tap the button “See all metrics” in the down-right corner of the table. A window will pop up, giving you more details.
All numbers refer to the selected filter (see above) and date range (last 30 days by default).
The numbers in this summary include:
Number of content: The number of content units in the selected filter (can be pages, blog posts and attachments)
Views: Views of content that is actively used.
Views of deleted content: Views of content accumulated before it was moved to the trash.
 This number does not include archived content. If users access the content of an archived space, the report will track the view.
Total views: All views of all content accumulated within the selected date range, whether it’s actively used or trashed.
Viewers: All Viewers who have accessed the content within the selected date range
Contributors: Number of Confluence users who have contributed to the content within the selected date range.
New content: Content created within the selected date range.
Edits: Number of page and blog post edits within the selected date range.
Deleted content: Number of deleted content within the selected date range.
- Archived content is not included in the “Deleted content”. You can filter for archived content using the filters.
Comments: The number of comments within the selected date range.
Content Actions
Since fall 2023, you can carry out quick actions directly in the overview table. For example, you can archive or delete a content piece that was not viewed for a long period.
Tap the three dots in the “Actions” column to:
Access the Content Report of this content
Archive this content
Delete this content
Access the page history
Access the attachments
Access the page information
View the page’s source
View the storage format
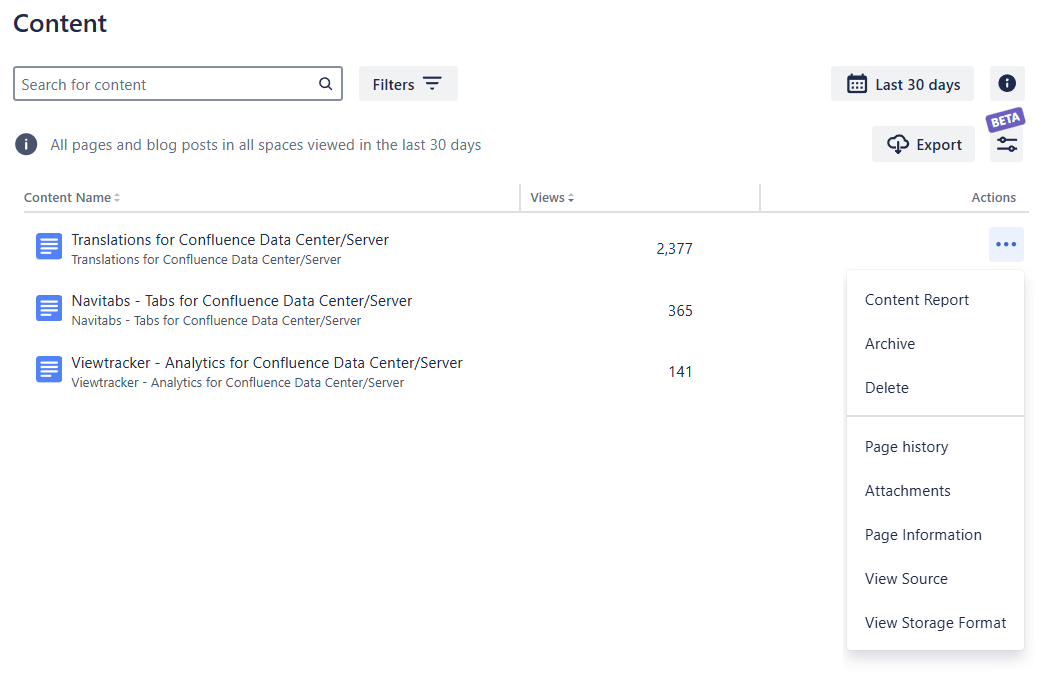
![]() Some of these actions will open a new tab. Depending on your permissions, you may not be allowed to carry out these actions.
Some of these actions will open a new tab. Depending on your permissions, you may not be allowed to carry out these actions.
Saving and sharing reports
Once you’ve applied a filter or changed the report's date range, the report’s URL will adapt with parameters like ?dateValue=this.week&contentType=blog.
This is useful for the following reasons:
You can copy and share the URL with co-workers who have the same access permission.
You can save the URL to access a customized report quickly.
Exporting options
You can export the metrics within this report as a CSV file. Locate the Export button at the top right of the report and click it. This will reveal two options: export the report and access the export overview.
![]() Note: If you need the username instead of the Account ID, please consult our FAQ: How do I find the username in the exported data?
Note: If you need the username instead of the Account ID, please consult our FAQ: How do I find the username in the exported data?
To the top ⬆️