🌐 Global Report
What the Global Report does for you
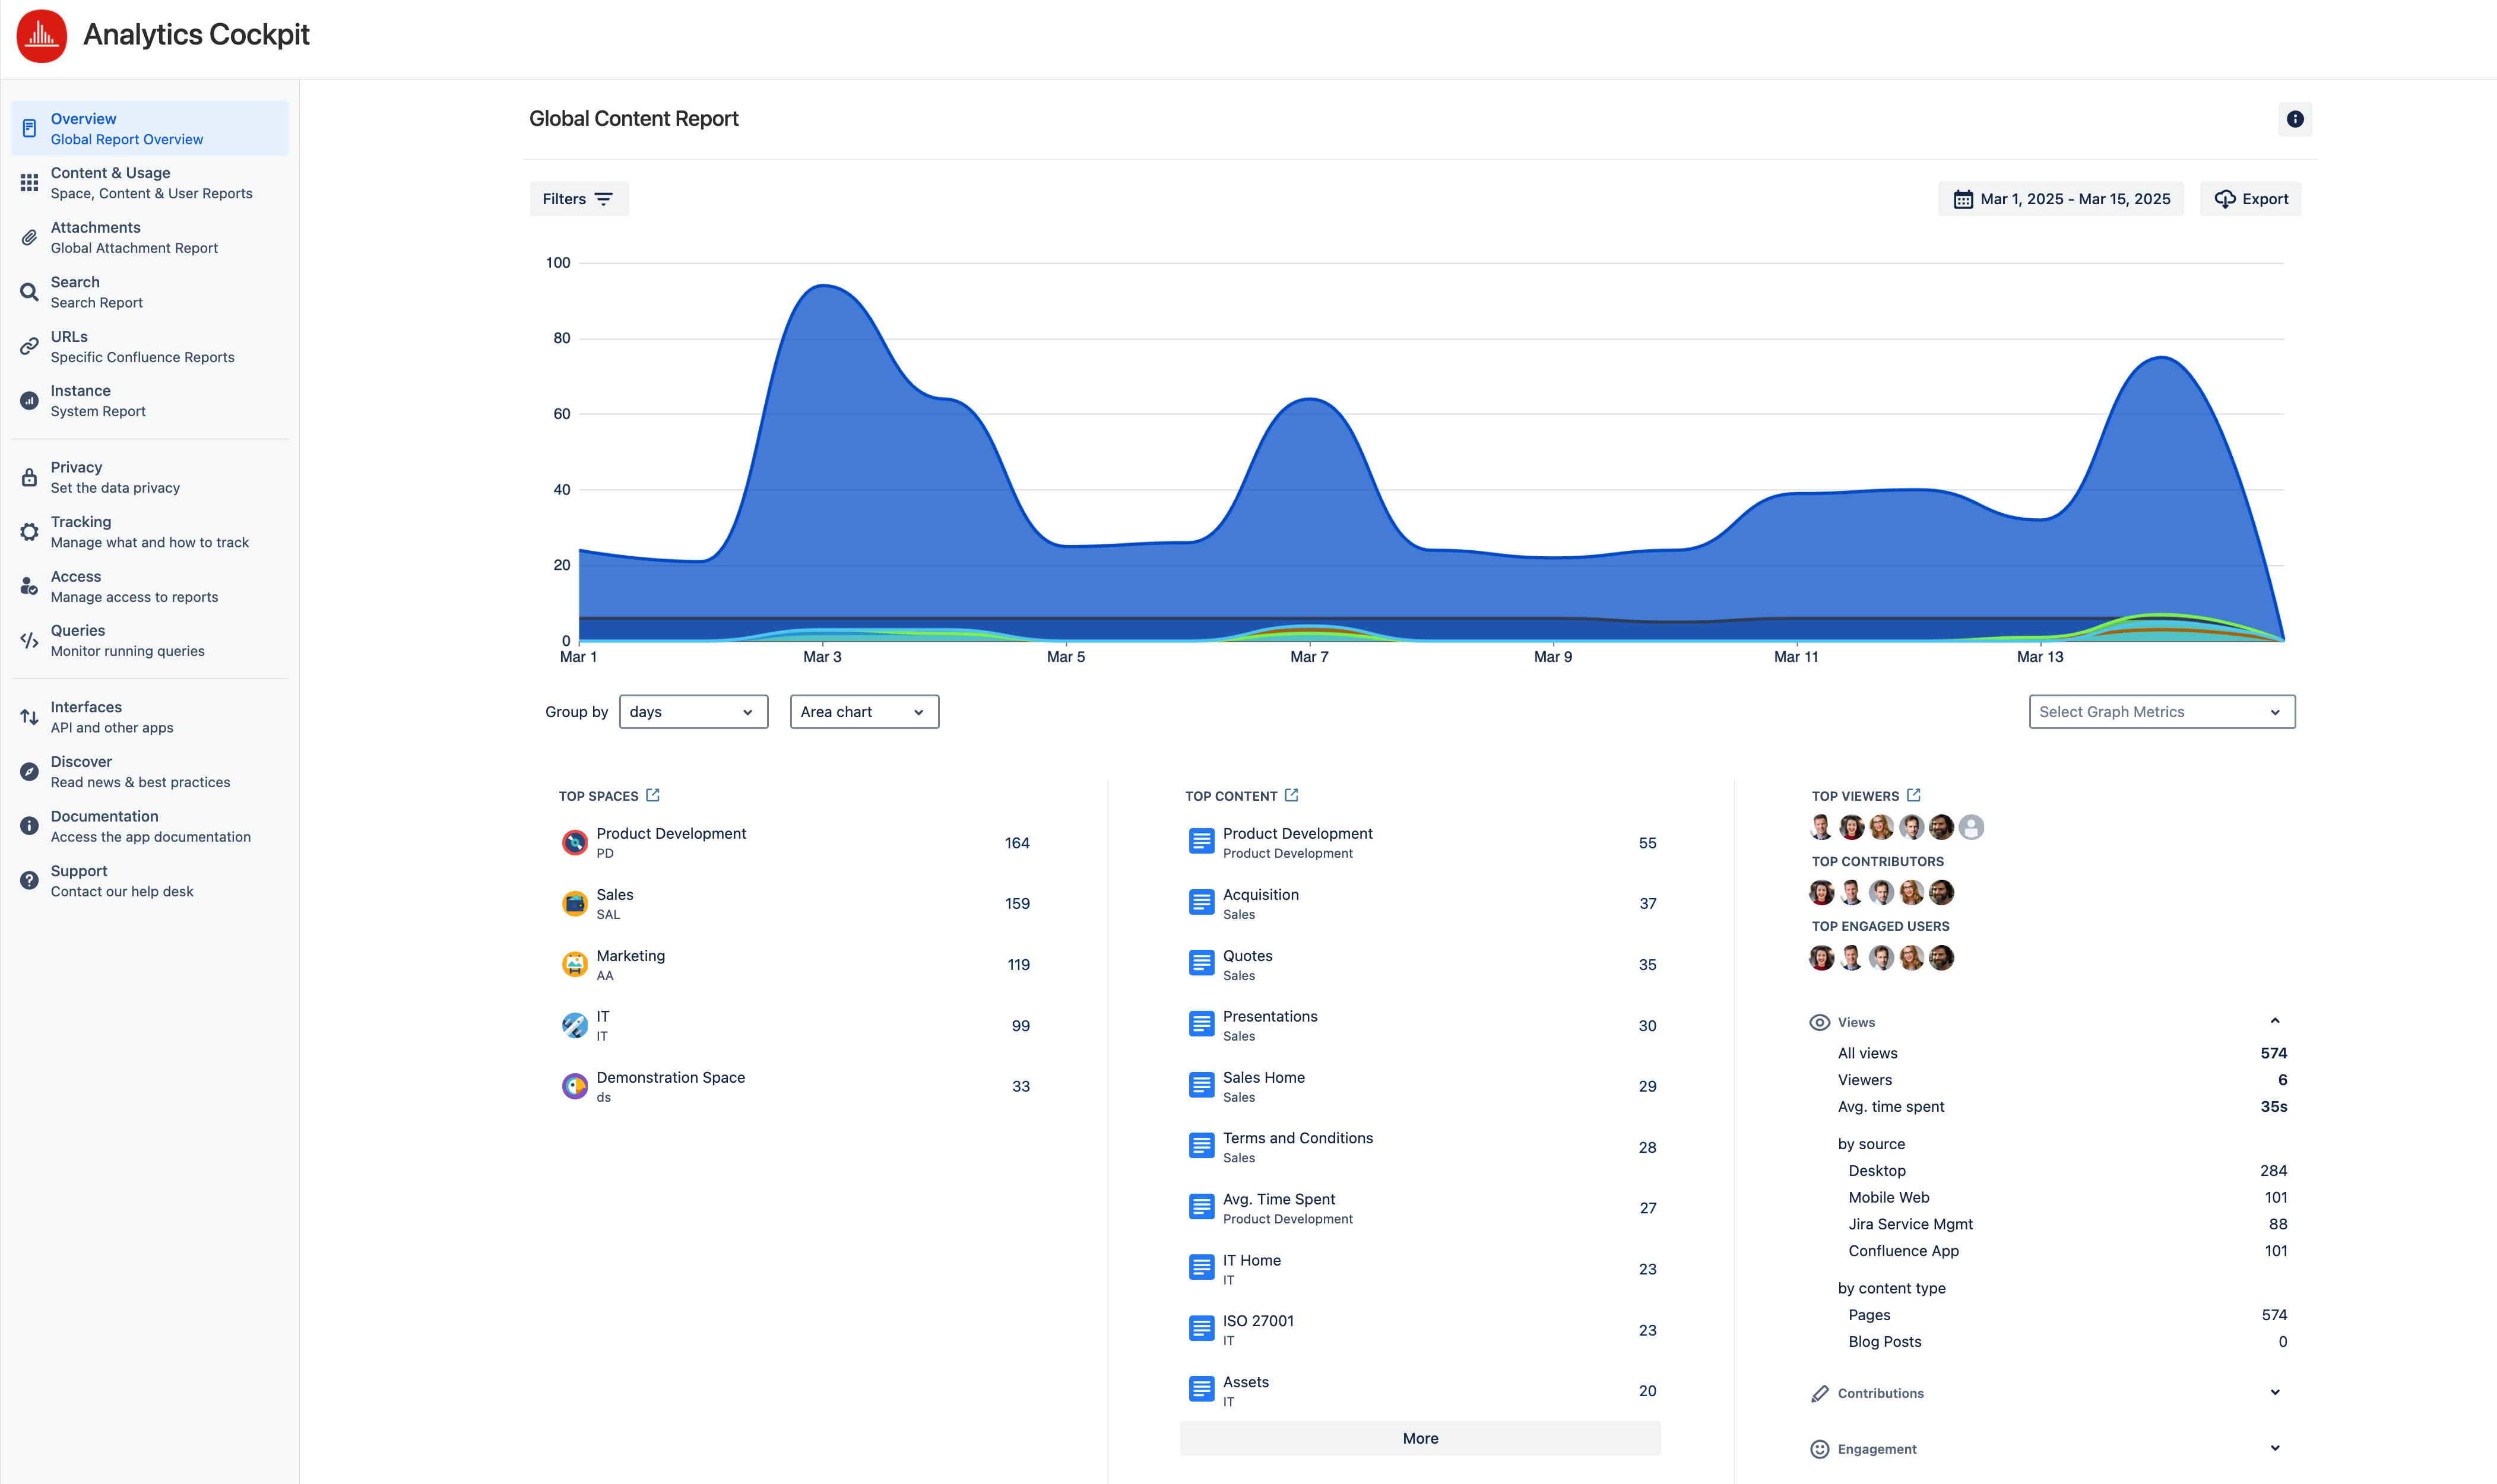
See all tracked data of your Confluence instance at one glance:
Page and attachment views, Content & Usage, searches, creations, comments, etc.
Filter the data by spaces, source (devices, Confluence app, Jira Service Management, etc.), content type (page, blog post), login state and space type (standard or private).
Select different date ranges and see the metrics and graph adapt.
Group the metrics in the graph by days (default), weeks, months, or years and display them as a Line (default), Area, or Bar chart.
Select which metrics to display in the graph.
Filter the data with the additional CQL filter.
Determine your instance's most viewed content and spaces (Top Content, Top Spaces).
Determine the most active users (with the most views) in your instance (depending on your privacy settings).
Identify the average time users (logged-in Confluence users, anonymous visitors, and readers of the Jira Service Management knowledge base) spent viewing or interacting with pages & blog posts across your instance. See Tracking settings for more details.
Grant a specific group access to the Global Report.
Export your data as a CSV file
Accessing the Global Report
You need to be a Confluence Administrator to access this data.
Alternatively, a Confluence Administrator can grant access to the Global Report by adding users to a dedicated group in Viewtracker's settings.
You can access the Global Report via ⚙→ Analytics Cockpit
The menu “Global Content Report” focuses on the content (pages, blog posts, spaces). See below for options in the Global Content Report.

Metrics in the Global Report
All metrics apply to the selected date range (default: 30 days)
Top spaces: The top 10 spaces, sorted by the number of views.
Tap the “More” button to load 10 more spaces (if available).
To see statistics for a specific space, tap one of the spaces in the list. This will open a new tab with direct access to the respective Space Report.
Top content: The top 10 pages or blog posts, sorted by the number of views.
Tap the “More” button to load 10 more results (if available).
Top viewers: The 10 users who created the most views.
Tap the link to open the detailed Content & Usage: Users report.
Top contributors: The 10 most active users (by edits, creations)
Top engaged users: The 10 most engaged users (by comments, likes and watches)
Views
all views: all views accumulated in the selected date range
viewers: see What are Viewers?
Avg. time spent: the average time a user (logged-in Confluence users, anonymous visitors, and readers of the Jira Service Management knowledge base) spent viewing or interacting with Pages & Blog posts across your instance. See Tracking settings.
by source: see Source Tracking
by content type: pages and blog posts
Contributions
New content: pages and blog posts newly created
Edits
Engagement
Comments
Likes on content
Likes on comments
Watches
Filtering the Global Content Report
If you are interested in specific spaces, sources or other metrics, you can use the pre-defined filters:
Filter by space (type at least two characters of your space name)
Filter by space status (current vs. archived spaces)
Filter by content type (page vs. blog post)
Filter by source; see Source Tracking
Filter by user’s login type: Select “Logged in Users” or “Anonymous Users”
Checkbox to exclude personal spaces
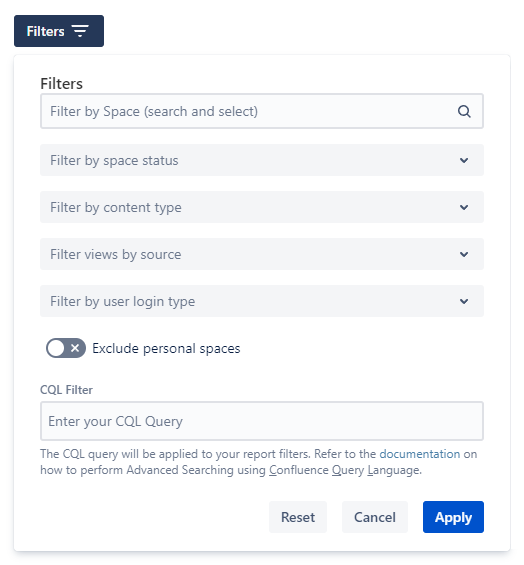
Screenshot: Filters available for the Global Report Overview
![]() You can use CQL to perform advanced searching. To do so, click on the "Filters" button and enter a valid CQL query. Atlassian's documentation explains CQL.
You can use CQL to perform advanced searching. To do so, click on the "Filters" button and enter a valid CQL query. Atlassian's documentation explains CQL.
For example, filter for pages edited by user "Edmond."”
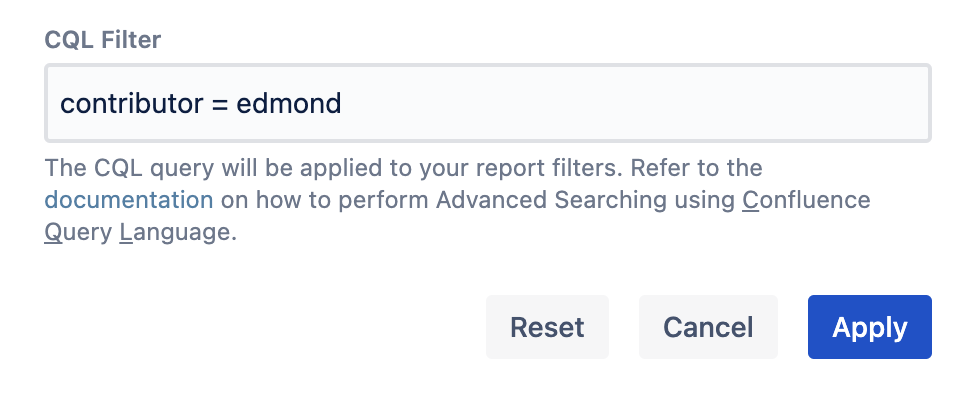
Example of the CQL filter.
Info on CQL Filter
To avoid performance problems, the CQL filter will only work for a maximum of 10,000 results.
The filter(s) will also be present in the Export.
Changing the date range and graph type
By default, data from the last 30 days are displayed. You can change that by clicking into the date field and selecting a different date range. All metrics will adapt automatically.
You can group the metrics in the graph by using “Group by” days (default), weeks, months, or years and display then in a Line (default), Bar or Area charts.
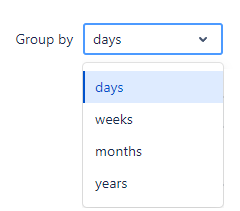
Time filters available.
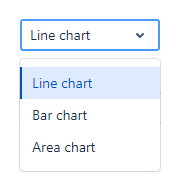
Chart types available.
Choosing which metrics to display in the graph
Below the graph, there is a drop-down menu listing the available metrics. By default, “Views”, “Creations” and “Edits” are selected.
Selected metrics will appear automatically in the graph, and the metric selection will be remembered the next time you access the report; the selected metrics will be displayed in the graph.
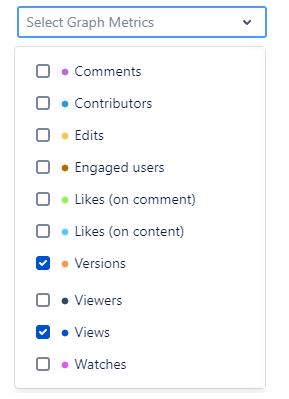
Metrics available for the Chart in the Global Report Overview
Navigating to other reports
You can access many other Viewtracker reports out of the Global Report.
Tap on any page name in the “Top content” column. This will open an overlay with the Content Report of that specific page.
The breadcrumbs can lead you to the Space Report (where the page is located) or the Global Report.
The entry on the right side of the breadcrumb is the page/blog post name. Tapping the name will open the page in a new tab so you can access its content.

Breadcrumb example.
Tap the link next to “Top Content” in the header to access the detailed content report.
Tap the link next to the “Top Viewers” in the header to access the detailed user report.

Screenshot highlighting shortcuts to the other reports.
![]() The date range and metric grouping selected in one report will automatically be adapted to the other reports.
The date range and metric grouping selected in one report will automatically be adapted to the other reports.
Saving and sharing reports
Once you’ve applied a filter or changed the report's date range, the report’s URL will adapt with parameters like:
?dateValue=this.week&contentType=blog.This is useful for the following reasons:
You can copy and share the URL with co-workers who have the same access permission.
You can save the URL to access a customized report quickly.
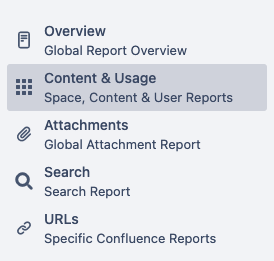
Content & Usage
Access this report by tapping the “Content & Usage” entry in the left menu.
See all information on this report on the dedicated page Content & Usage Report.
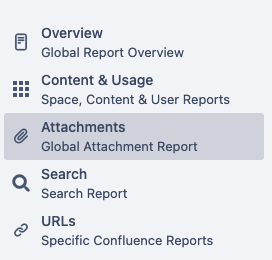
Global Attachments Report
Access this report by tapping the “Attachments” entry in the left menu.
See all information on this report on the dedicated page of the Attachments Report.
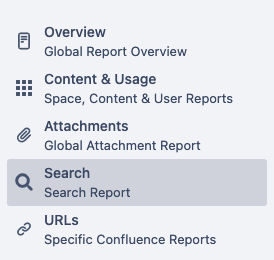
Global Search Report
Access this report by tapping the “Search” entry in the left menu.
See all information on this report on the dedicated page Search Report.
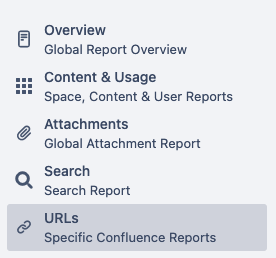
Confluence URL Reports
Access this report by tapping the “URLs” entry in the left menu.
See all information on this report on the dedicated page Confluence URL Reports.
Exporting reports
You can export the content data in the Global Report as a CSV file; see Export Data.
Granting access to the Global Report
See Manage Access to Viewtracker Reports
