📂 Space Report
See how many people have viewed or interacted with a specific space and the attachments it contains. Apply powerful filters for the most relevant metrics.
Access the Space Report
To access the Space Report follow the steps below.
Navigate to the space you want to see the report for.
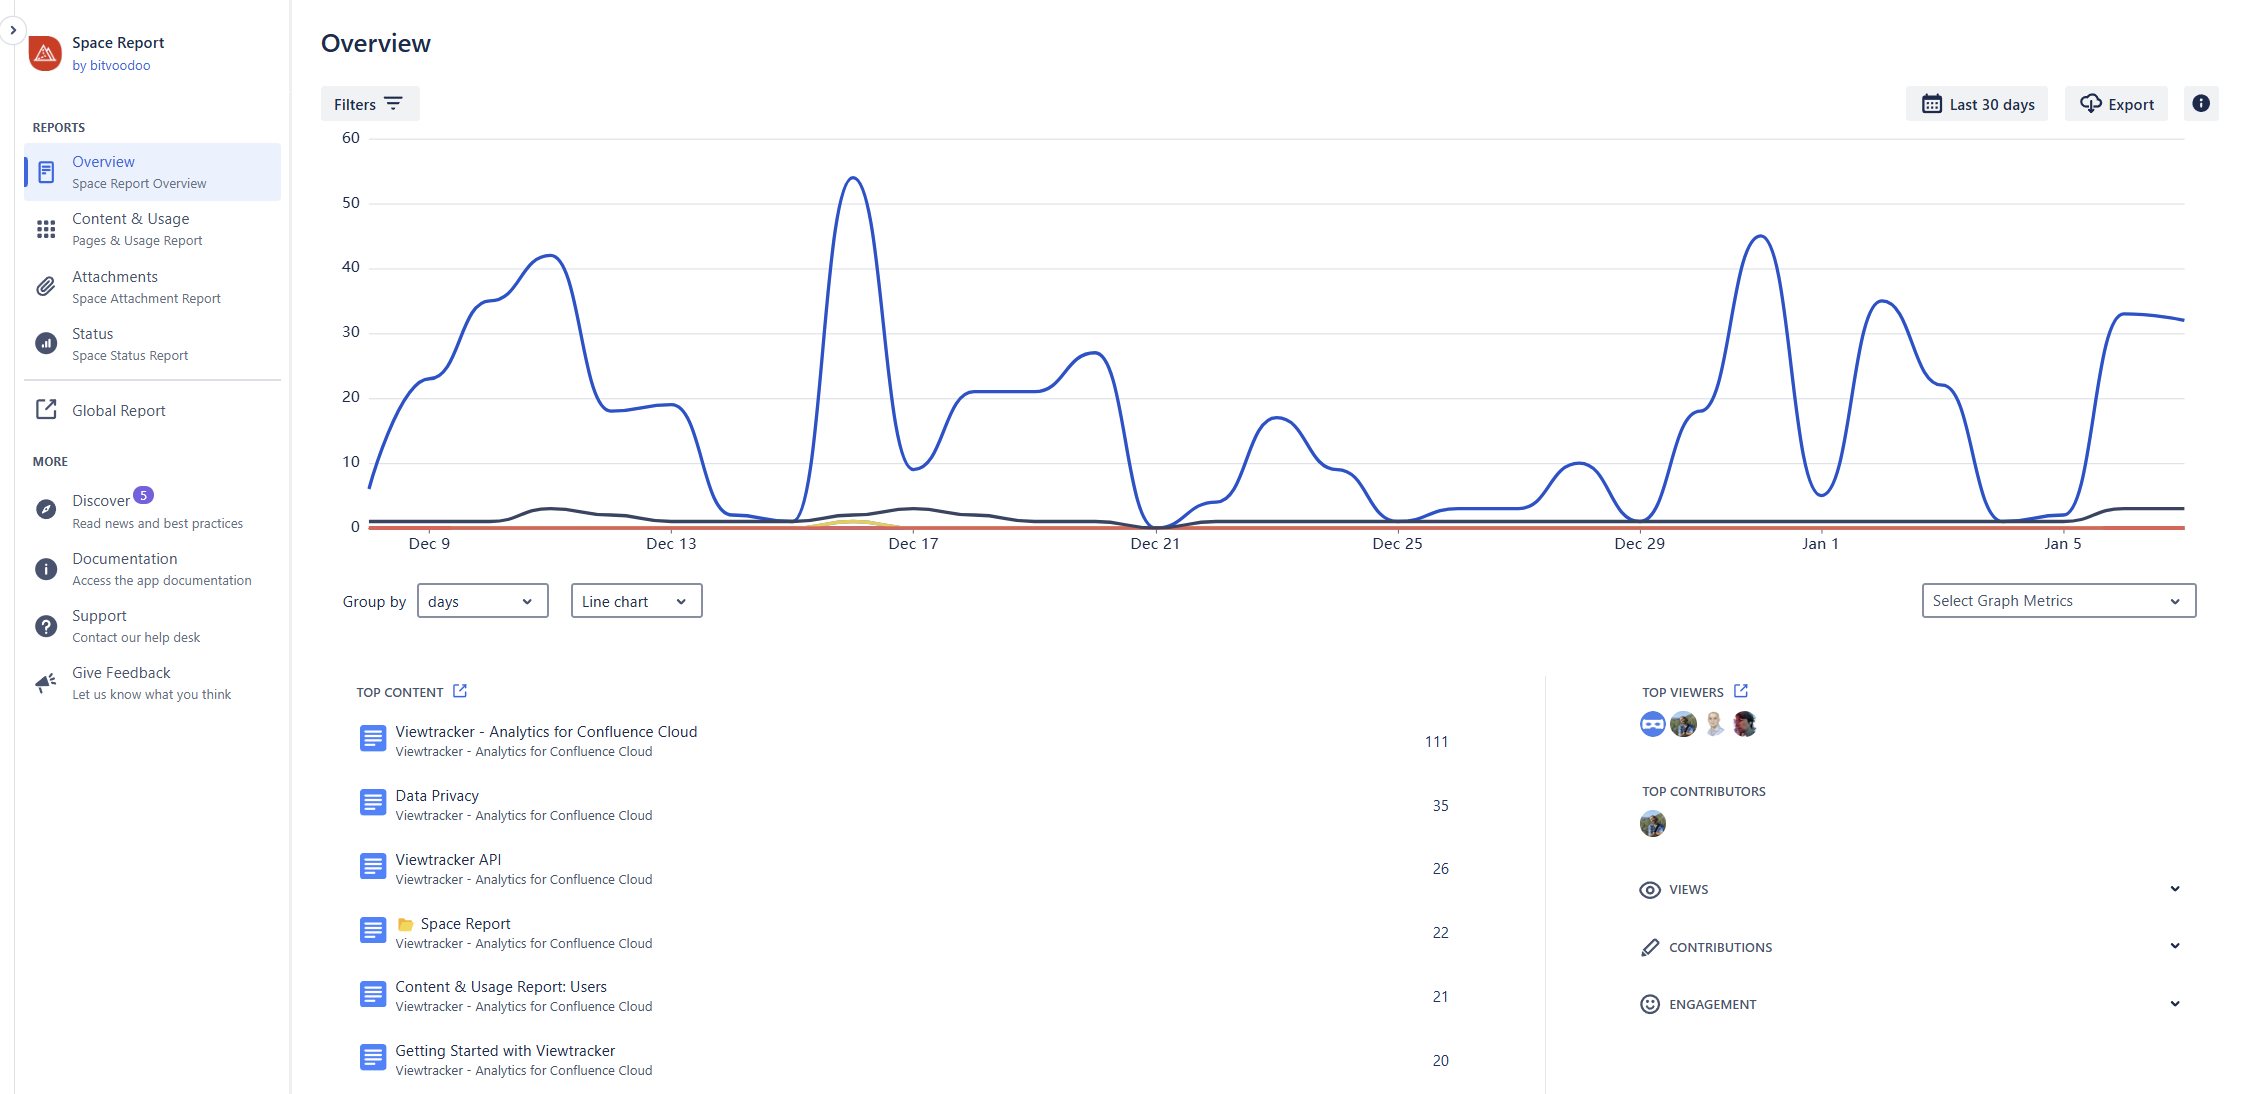
In the left sidebar, under Apps, click on "Space Report."
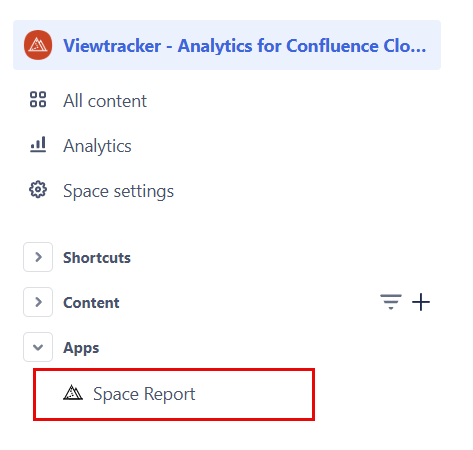
The Space Report will appear. It contains the sections “Overview”, “Content & Usage” and “Attachments”. It also offers a direct link to the Global Report and the Access Permission (see below).
![]() It can take up to 1 minute before recent views are displayed in the report.
It can take up to 1 minute before recent views are displayed in the report.
Space Report Overview (Default)

Elements of the Space Report Overview
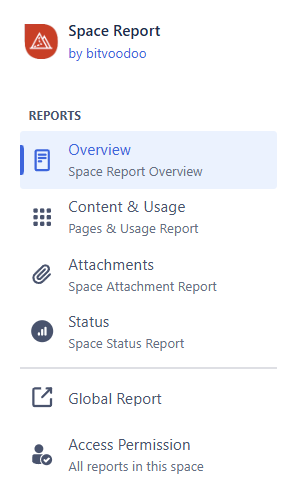
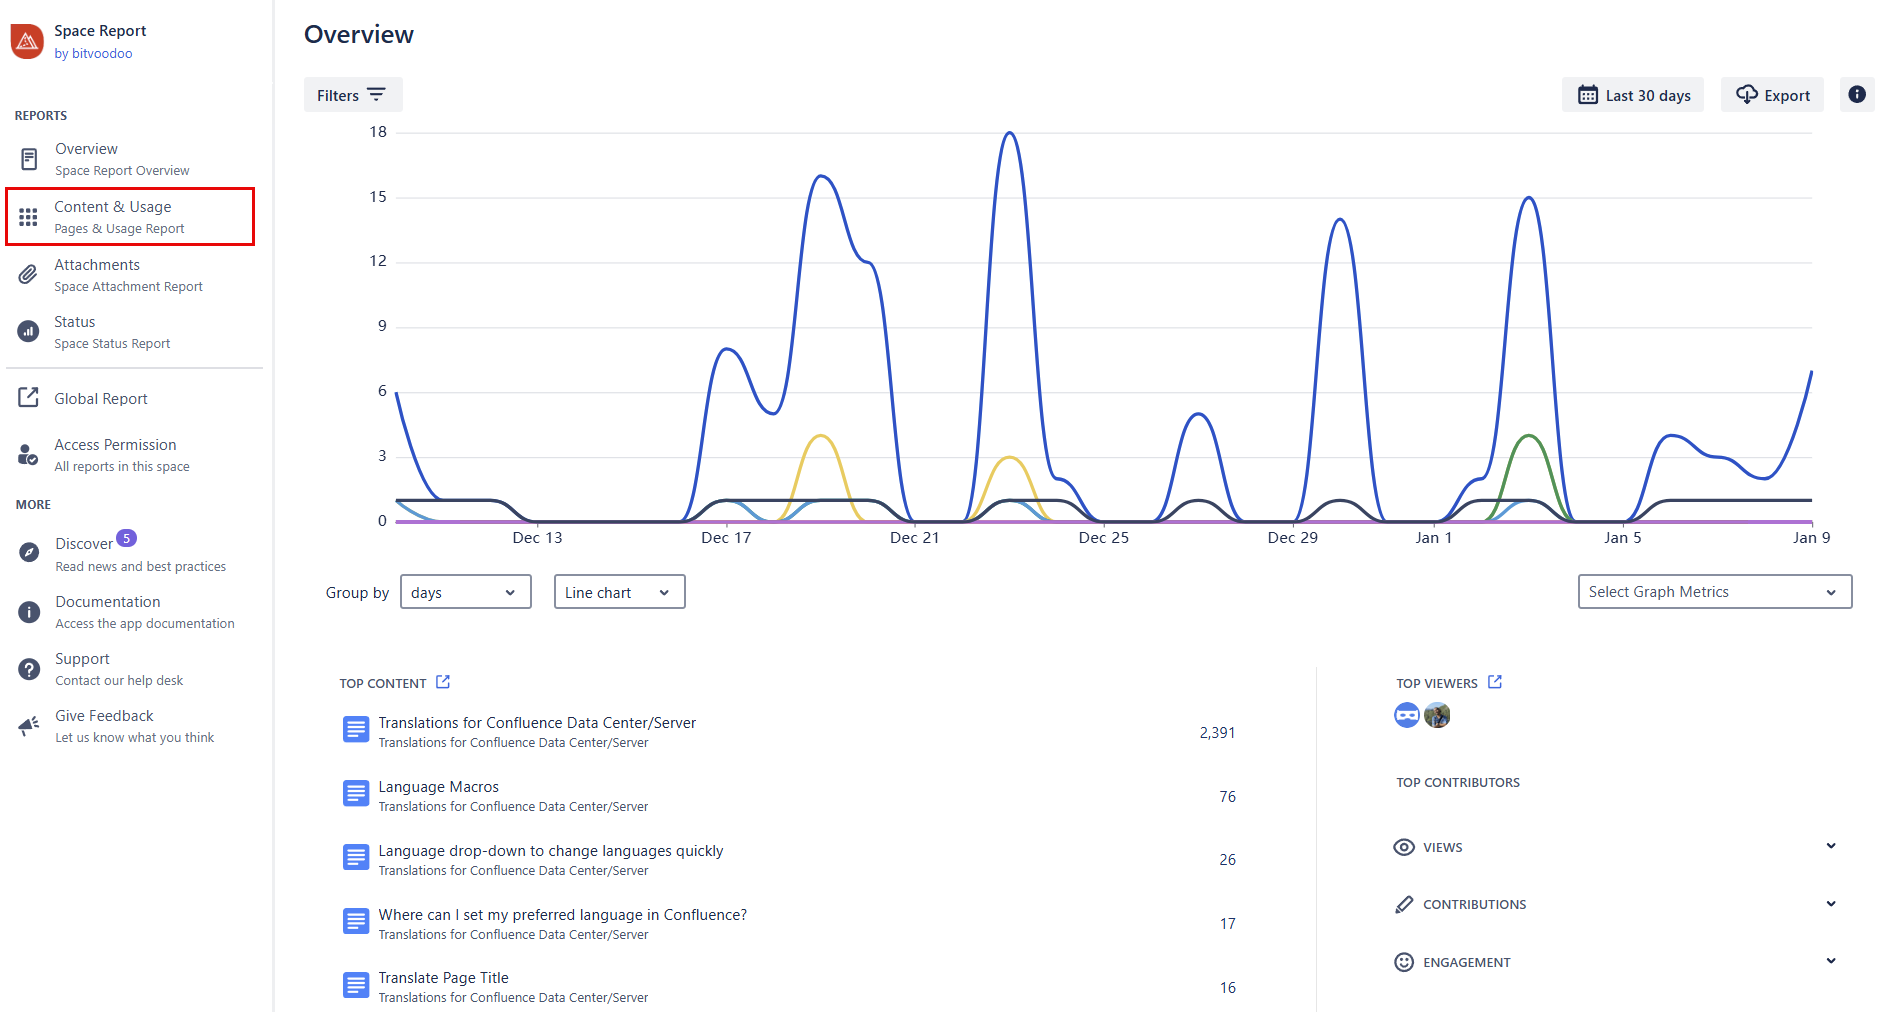
Graph of the views, edits and creations in the current space. The default period is the last 30 days. Click on the date picker to change the time period. Read more about the graph below ⤵️.
Top content: The top 10 pages or blog posts in this space, sorted by the number of views. Click on any title to the Content Report of the page.
Tap the link in the header to access the detailed content report.Top viewers: The users who created the most views in this space. Click on their icons to learn more about them.
Tap the link in the header to access the detailed user report.Top contributors: The users who created or edited the most content in this space. Click on their icons to learn more about them.
Views
all views: all space views accumulated in the selected date range
Viewers: logged-in and anonymous users
by source: Confluence and Scroll Viewport
by content type: pages and blog posts
Contributions
Contributors: users who created or edited content
New content: pages and blog posts newly created
Edits
Engagement
Comments
Filter options
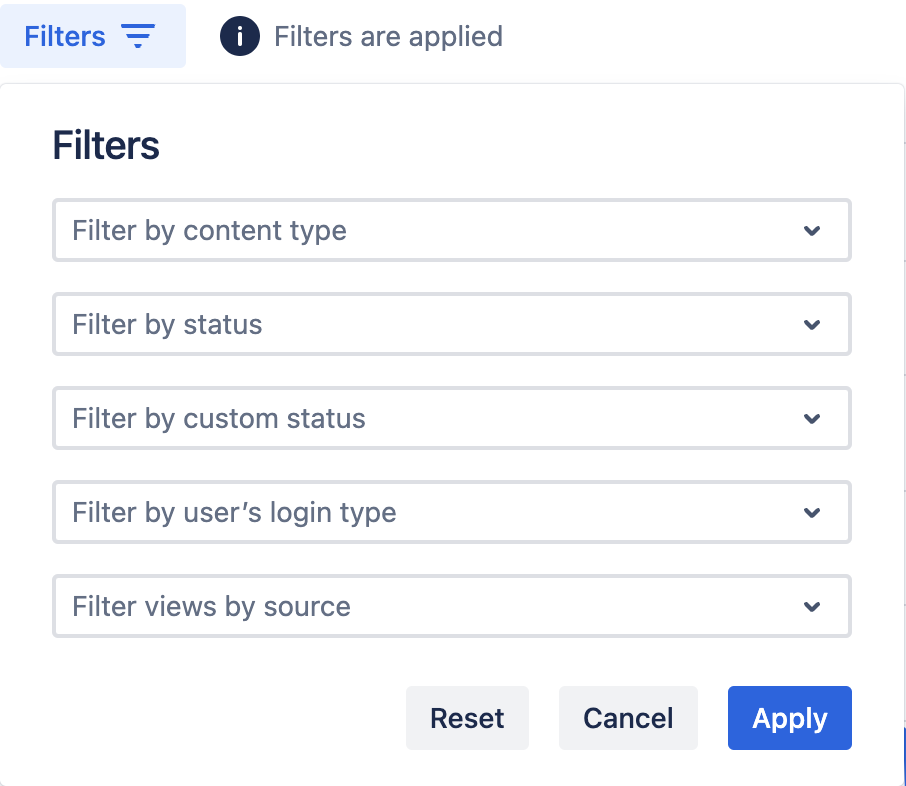
You can filter the metrics with powerful filters to get the most relevant metrics:
Filter by content type: Select “Pages” or “Blog Posts”.
Filter by status: Select “Current” or “Archived” for active or archived pages or blog posts. This filter is only available for Space admins.
Filter by custom status: Select any content status. This filter is only available for Space admins.
Filter by user’s login type: Select “Logged-in Users” or “Anonymous Users”.
Filter views by source: Choose Confluence or Scroll Viewport.
Tap “Apply”, and the metrics in the table will adapt automatically. Note: The source filter only applies to the views, not other metrics.
Filters in the Space Report
Content & Usage Reports: Space level
The information on the use of the Content & Usage Report can be viewed on this separate page.
Space Attachments Report:
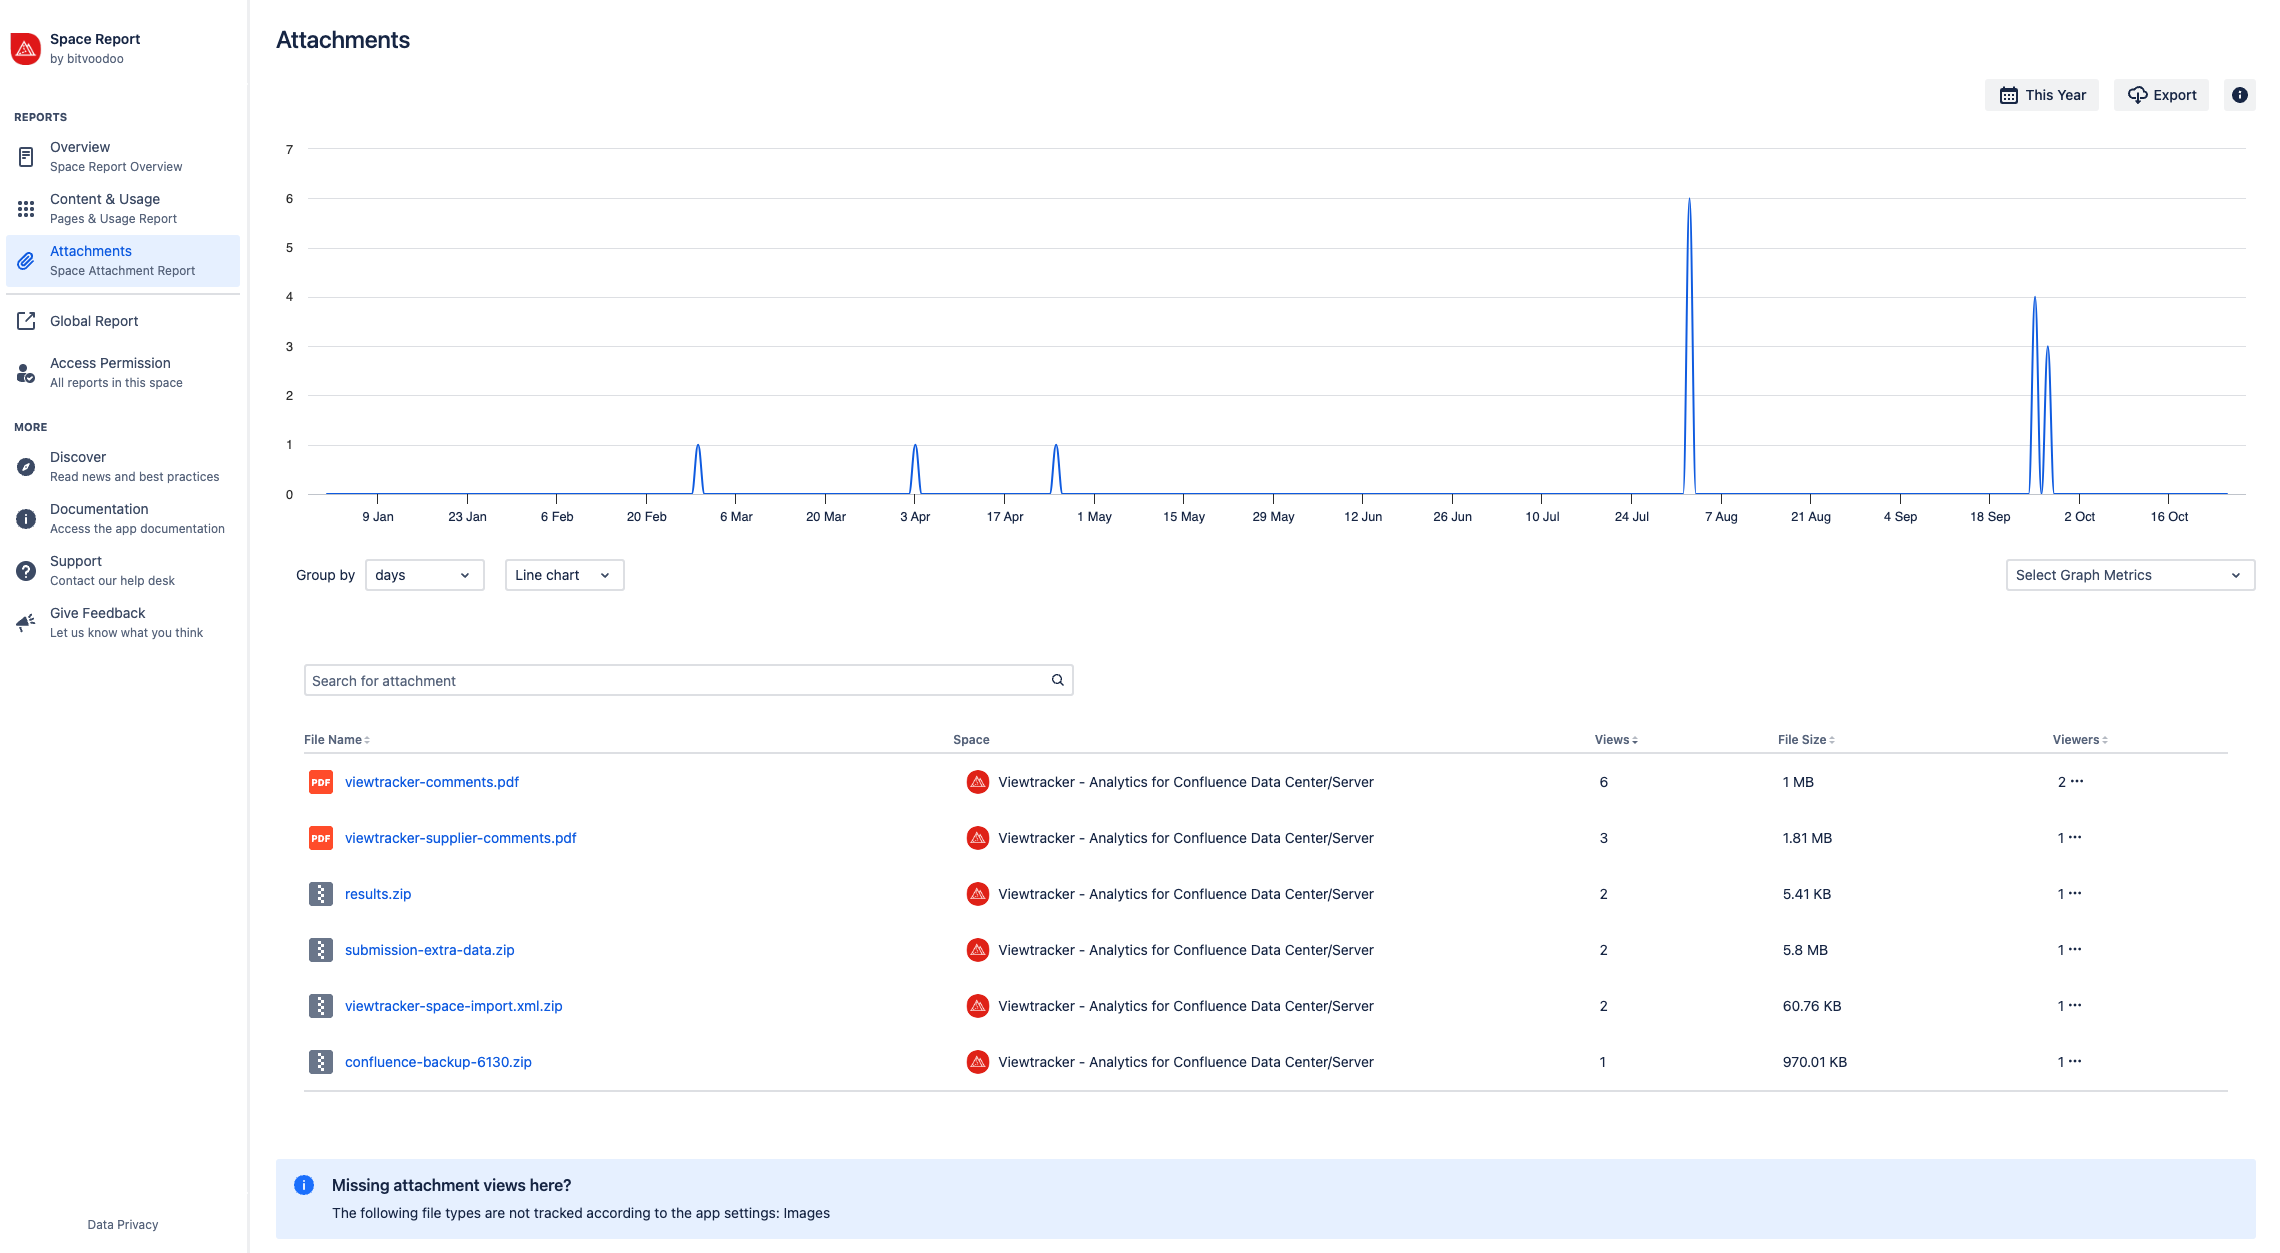
Click on the menu "Attachments" to display:
a graph of the attachment views in the current space. The default period is the last 30 days. Click on the date picker to change the time period.
Column "File name": The file names and file types (icon) of the attachments used in that space.
Column “Space”: The current space
Column "Views": The number of views or downloads of each attachment.
Column “Viewers”: The Confluence users who viewed or downloaded a specific attachment.
Settings and filters:
Use the search field to search for specific attachments.
Filter by status: Select “Current” or “Archived” for active or archived attachments. This filter is only available for Space admins.
You can group the metrics in the graph by using “Group by” days (default), weeks, months, or years.
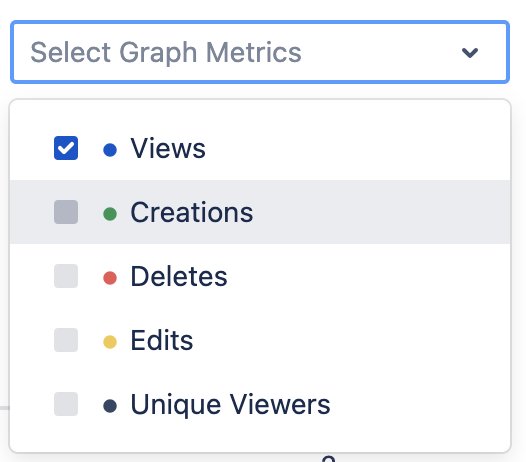
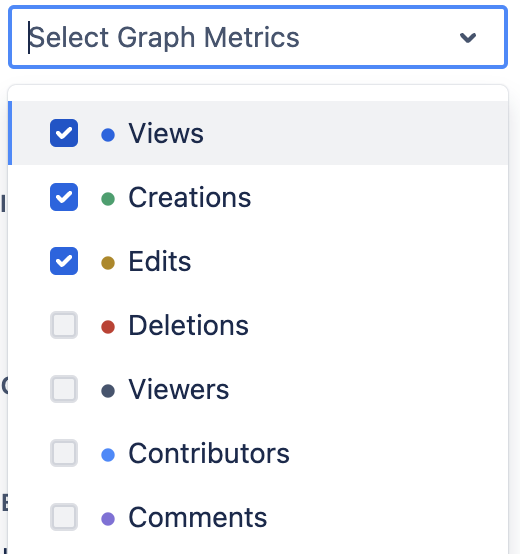
Below the graph, there is a drop-down menu listing the available metrics. By default, “Views” are selected. Select the metrics you want to appear in the graph.
Changing the date range and graph type
As a default, the data from the last 30 days are displayed. You can change that by clicking into the date field and selecting a different date range. All metrics will adapt automatically.
You can group the metrics in the graph by using “Group by” days (default), weeks, months, or years.
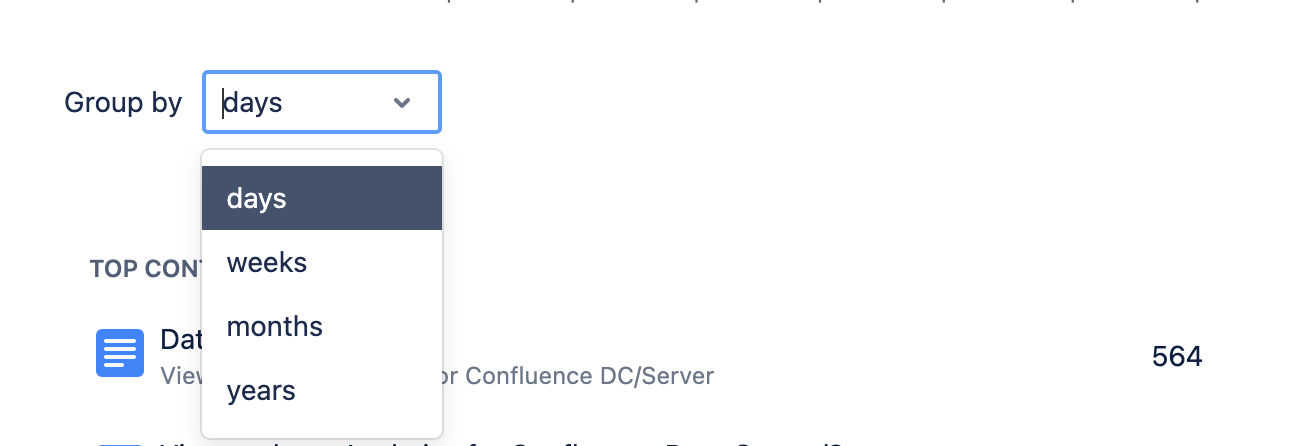
Grouping metrics in the graph (drop-down menu)
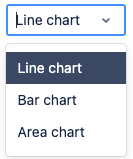
You can display the numbers as a line chart (default), bar chart, or area chart.
Choosing which metrics to display in the graph
Below the graph, there is a drop-down menu listing the available metrics. By default, “Views”, “Creations” and “Edits” are selected.
Select the metrics you want to appear in the graph, and the graph will adapt automatically. Viewtracker saves the metric selection; whenever you access the report in the future, the selected metrics will be displayed in the graph.
Navigating to other reports
You can access many other Viewtracker reports out of the Space Report.
Use the shortcut “Global Report” in the left menu to access the Global Report (depending on your access permission). The Global Report will open as a new tab.
Tap on any page name in the “Top content” column. This will open an overlay with the Content Report of that specific page. The breadcrumbs lead you to the Global Report or the Space Report.
The entry on the right side of the breadcrumb is the page/blog post name. Tapping the name will open the page in a new tab so you can access its content.
Breadcrumb to other reports
Tap the link next to “Top Content” in the header to access the detailed content report.
Tap the link next to the “Top Viewers” in the header to access the detailed user report.
![]() The date range and metric grouping selected in one report will automatically be adapted to the other reports.
The date range and metric grouping selected in one report will automatically be adapted to the other reports.
Saving and sharing reports
Once you’ve applied a filter or changed the report's date range, the report’s URL will adapt with parameters like ?dateValue=this.week&contentType=blog.
This is useful for the following reasons:
You can copy and share the URL with co-workers with the same access permission.
You can save the URL to access a customized report quickly.
Exporting reports
You can export the data in the Space Report as a CSV file; see Export Data.
Restricting access to the Space Report
By default, the Content Report and Space Report can be accessed by any user with a Confluence login. However, a Confluence administrator or a space administrator can restrict access to the Space Report. Read here for the complete documentation: Access Permission
Related content
Not what you were looking for? Viewtracker has a range of powerful reports that might interest you:
If you'd like to see the statistics of various spaces, you need to use the Global Report or the Content & Usage Report for Spaces.
For more information on the content and the users of this space, use the Content & Usage Report.
For technical KPIs of a particular space, use the Space Status Report.
