🌐 Global Report
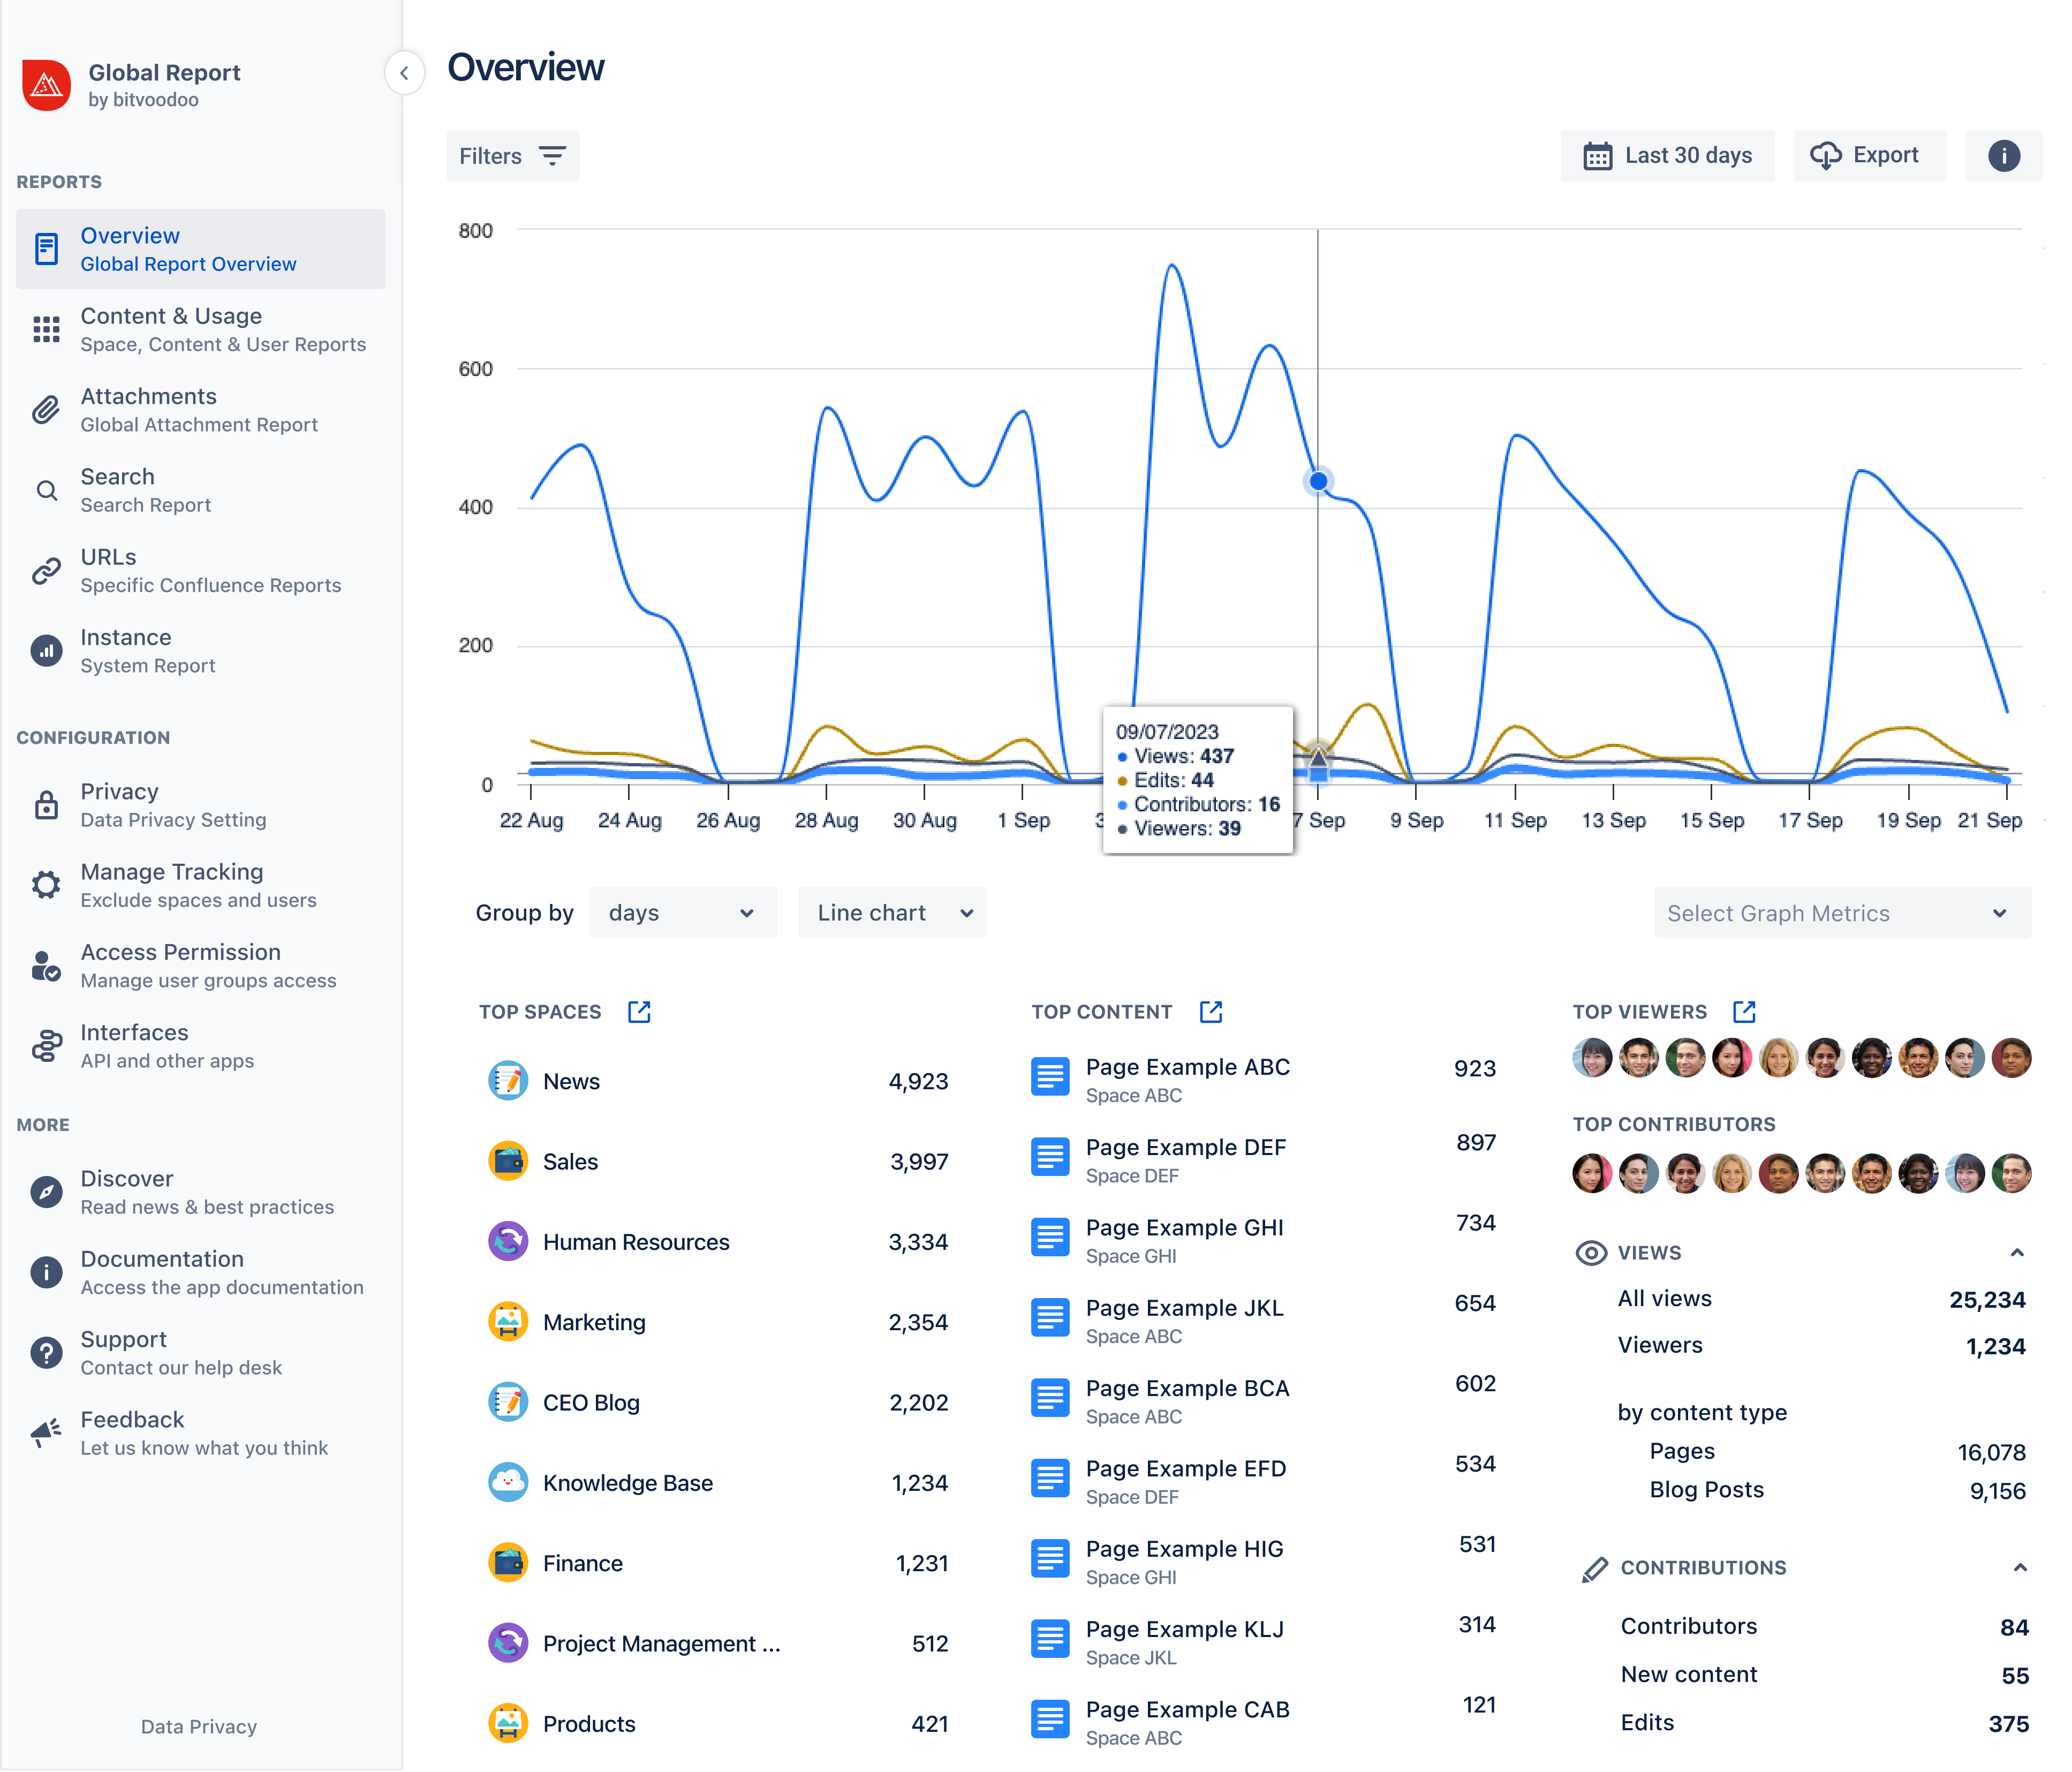
Get statistics of your entire Confluence site, divided in multiple powerful reports (overview with all relevant usage metrics, content & usage, attachment tracking, search analytics).
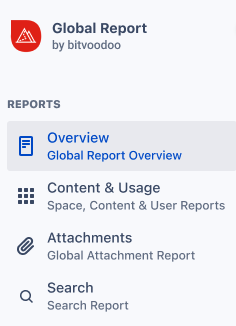
Global Report with sub-reports
As a Confluence administrator, you have access to Viewtracker's Global Report. This will give you a wide variety of Viewtracker KPIs.
An administrator can also grant access permission to non-admins; see Global Report access permission
How to access the Global Report
Click on Confluence Settings in the Confluence header.
Under the heading "Viewtracker", select "Global Report".
Alternatively, go to "Apps" in the Confluence header and select "Viewtracker - Global Report".
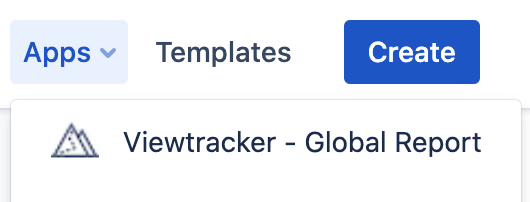
The statistics of your entire Confluence site will appear. The Overview Report is opened by default.
![]() It can take up to 1 minute before the views are displayed in the report.
It can take up to 1 minute before the views are displayed in the report.
Global Report Overview (Default)

Elements of the Global Report Overview
Graph of the views, viewers, edits, creations, deletions, contributors and comments over time. The default period is the last 30 days. Click on the date picker to change the time period.
Top spaces: The top 10 spaces, sorted by the number of views. Click on any space name to open that space in a new tab.
Top content: The top 10 pages or blog posts, sorted by the number of views. Click on any title to open the content in a new tab.
Top viewers: The 10 users who created the most views. Tap the link to open the detailed Content & Usage User Report. This element is not visible if the Extended Privacy Mode is enabled.
Top contributors: The 10 most active users (by edits, creations)
Views
all views: all views accumulated in the selected date range
Viewers (depending on the selected Data Privacy)
by content type: pages and blog posts
Contributions
New content: pages and blog posts newly created
Edits
Engagement
Comments
If you want to have even more insights, tap the icon ↗️ next to “Top Spaces”, “Top Content” or “Top Viewers”. This will lead you to the complete Content & Usage Report for spaces, content, or users. You can filter this report, then download it as a CSV file.

Filter options
You can filter the report. All statistics will adapt to the filter automatically.
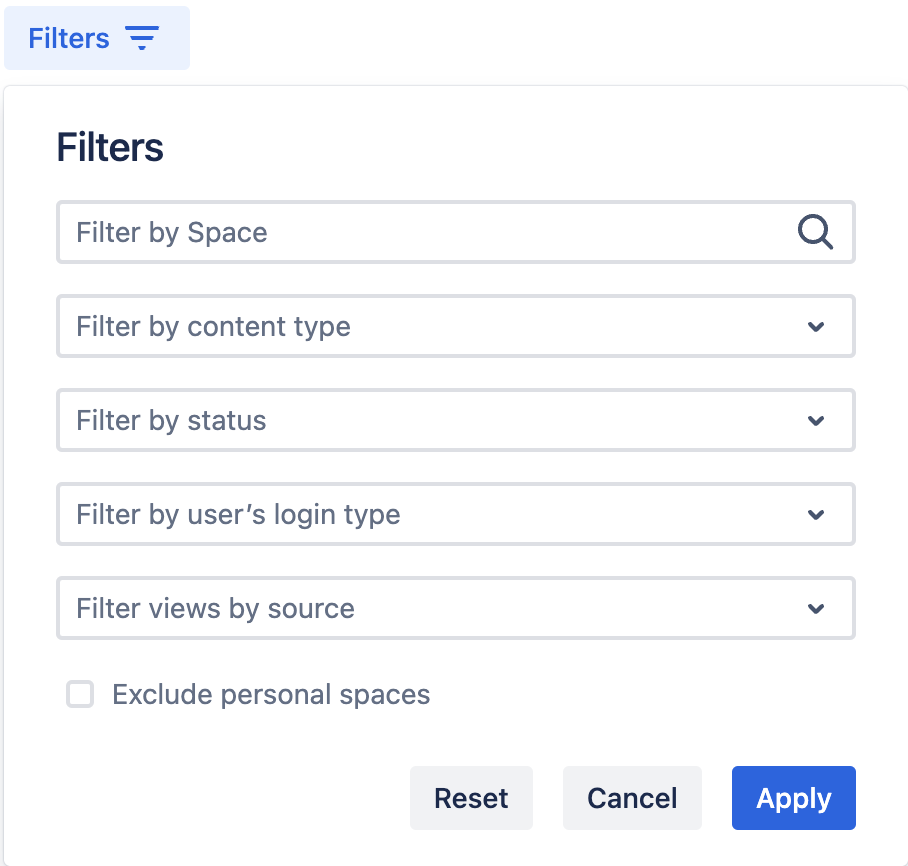
Filters in the Global Report
Filter by Space: Type the space name(s) into the input field and tap “Apply”.
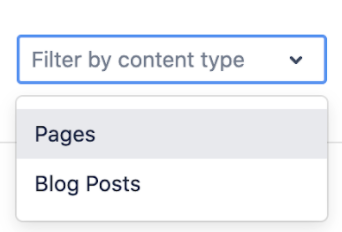
Filter by content type: Select pages or blog posts and tap “Apply”.
Filter by status: Select “Current” or “Archived”.
Filter by user’s login type: Select “Logged in Users” or “Anonymous Users”
Filter views by source: Select “Confluence” or “Scroll Viewport”.
Checkbox to exclude personal spaces
If space or content filters are applied, the “Filters” button will change to dark grey.

Changing the date range and graph type
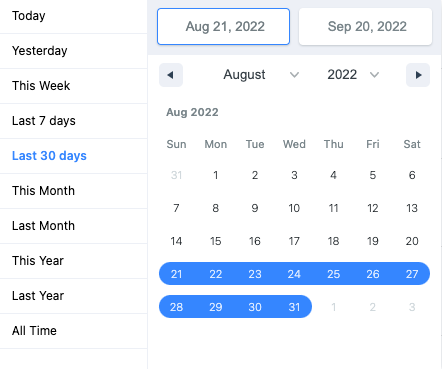
As a default, the data from the last 30 days are displayed. You can change that by clicking into the date field and selecting a different date range. All metrics will adapt automatically.
You can group the metrics in the graph by using “Group by” days (default), weeks, months, or years.
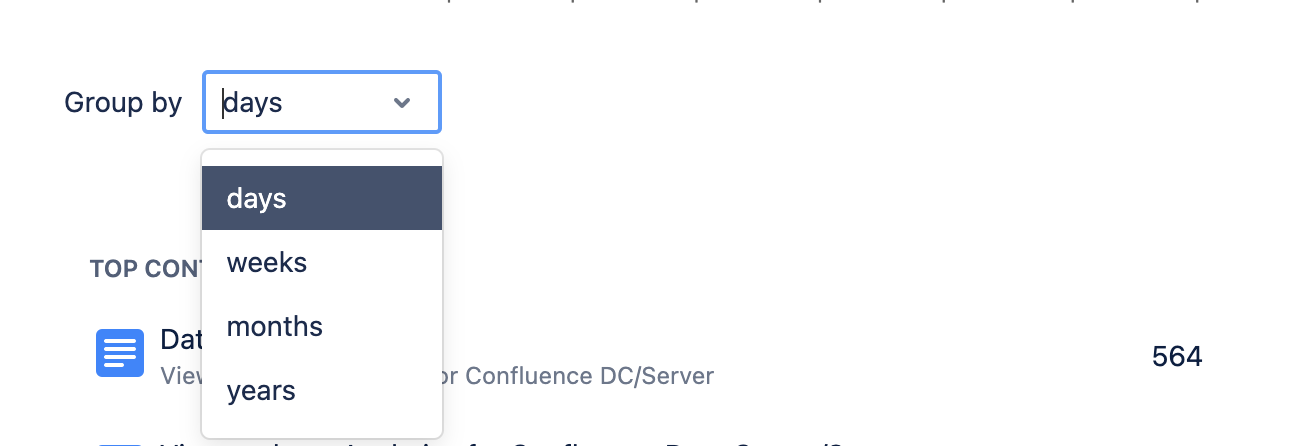
Grouping metrics in the graph (drop-down menu)
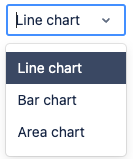
You can display the numbers as a line chart (default), bar chart, or area chart.
Choosing which metrics to display in the graph
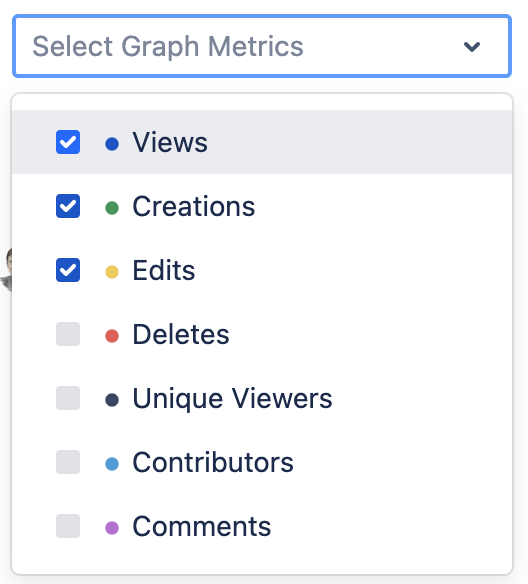
Below the graph, there is a drop-down menu listing the available metrics. By default, “Views”, “Creations” and “Edits” are selected.
Select the metrics you want to appear in the graph, and the graph will adapt automatically. Viewtracker saves the metric selection; whenever you access the report in the future, the selected metrics will be displayed in the graph.
Navigating to other reports
You can access many other Viewtracker reports out of the Global Report.
Tap on any page name in the “Top content” column. This will open an overlay with the Content Report of that specific page. The breadcrumbs lead you to the Space Report or back to the Global Report (both opening in a new tab).
The entry on the right side of the breadcrumb is the page/blog post name. Tapping the name will open the page in a new tab so you can access its content.
Breadcrumb to other reports
Tap the link next to “Top Spaces” in the header to access the detailed spaces report.
Tap the link next to “Top Content” in the header to access the detailed content report.
Tap the link next to the “Top Viewers” in the header to access the detailed user report.
![]() The date range and metric grouping selected in one report will automatically be adapted to the other reports.
The date range and metric grouping selected in one report will automatically be adapted to the other reports.
Saving and sharing reports
Once you’ve applied a filter or changed the report's date range, the report’s URL will adapt with parameters like ?dateValue=this.week&contentType=blog.
This is useful for the following reasons:
You can copy and share the URL with co-workers with the same access permission.
You can save the URL to access a customized report quickly.
Exporting Reports
You can export all the reports as a CSV file, see Export Data. Any filters you applied before will be reflected in the CSV file.
Global Content & Usage Report
This report and its filtering possibilities are explained on a separate documentation.
Global Attachments Report
This report and its possibilities are explained on a separate documentation.
Global Search Report
This report and its possibilities are explained on a separate documentation.
Related content
Viewtracker has a range of powerful reports that might interest you:
📶 Instance Report for administrators
Space Status Report for space administrators
📂 Space Report for space administrators
